SERVICE DESIGN WATER CORPORATION · 2021
Mapping
Water outages
Mapping the end-to-end water outage experience to drive systemic change across a complex, multi-team organisation.
ROLE
Lead Service Designer
DURATION
6 months, 2021
DISCIPLINES
Service design · Research
Facilitation · Capability building
STAKEHOLDERS
60+ across 10 teams
17%
reduction in pipe leaks
and bursts 2020 - 2022
489k
households affected by
outages annually
57k
annual customer contacts
about outages
172+
research insights in a
new centralised database
THE PROBLEM
A system failing in plain sight
Water outages affect about a third of all properties in Western Australia every year. That’s 489,000 households without water for a median of 54 minutes, usually with no warning. For most people this can be frustrating. For a dialysis patient, doctor’s surgery, dentist, farmer, it can have significant safety, health or financial ramifications.
The numbers were only getting worse with the number of outages increasing ~5% each year, driven by ageing infrastructure (old pipes) and upstream process inefficiencies. A combination of organisational silos, clunky internal systems and poor process governance made outage management largely inefficient and near impossible to track - causing financial and reputational costs to Water Corp. Outage resolution times were slower, staff head count per issue was high and customer calls were increasing, with 57,000 outage related customer contacts annually.
I was brought in to map the process end-to-end, understand how outages were actually managed across every team involved, and identify where change would drive real impact - for customers and the business.
25%
of outages were completely missing from the internal management system
85%
of unplanned outages weren't logged until after the water was already off
489k
WA households affected by
outages annually
MY ROLE
I had two key roles to play
Lead the design methodology
I was brought in as an embedded team member to augment the existing design team and lead the design framework for this project. The organisation were able to justify the spend because of the high cost and reputational impact outages were creating. It was a critical problem to solve.
Build the capability and scalable design method
The team were fairly new to human-centred design so I was required to create a scalable design framework they could apply to future projects. The research database, the frameworks, the prioritisation tools were all designed to be reusable once I was gone.
MY APPROACH
Layering the staff experience with the customer journey
The instinct in many CX projects is to go straight to the customer. I made a deliberate call to start by unpacking the staff experience because it was clear, after initial consultation with senior stakeholders, that the real dysfunction was happening behind the scenes.
Over six months I ran 15+ workshops and one-on-ones across 10 different teams. I sat in the Operations Centre and listened to live calls while watching staff work across multiple systems simultaneously. I joined field crew on site. Most of these teams had never been asked about their experience before and were thrilled to talk. The knowledge was all there - it just hadn't been surfaced or connected.
15+ workshops
10 internal teams
656 residential surveys
Experienced outage <6 months
64 non-residential surveys
businesses & key customers
VOC + call listening
social media analysis
Live observation
OC, field crew, reinstatements
172+ research insights
new centralised database
CREATING A RESEARCH DATABASE
I built Water Corp’s first centralised research database (using our best friend, Excel). It was designed to capture and categorise all workshop and research findings in one place. It served as live demonstration of research documentation best-practice and as an aid to improve knowledge sharing between teams. The simple spreadsheet outlived the project and sparked an investment in Dovetail, which the team uses to this day.
THE STAFF EXPERIENCE
Mapping the teams to the process
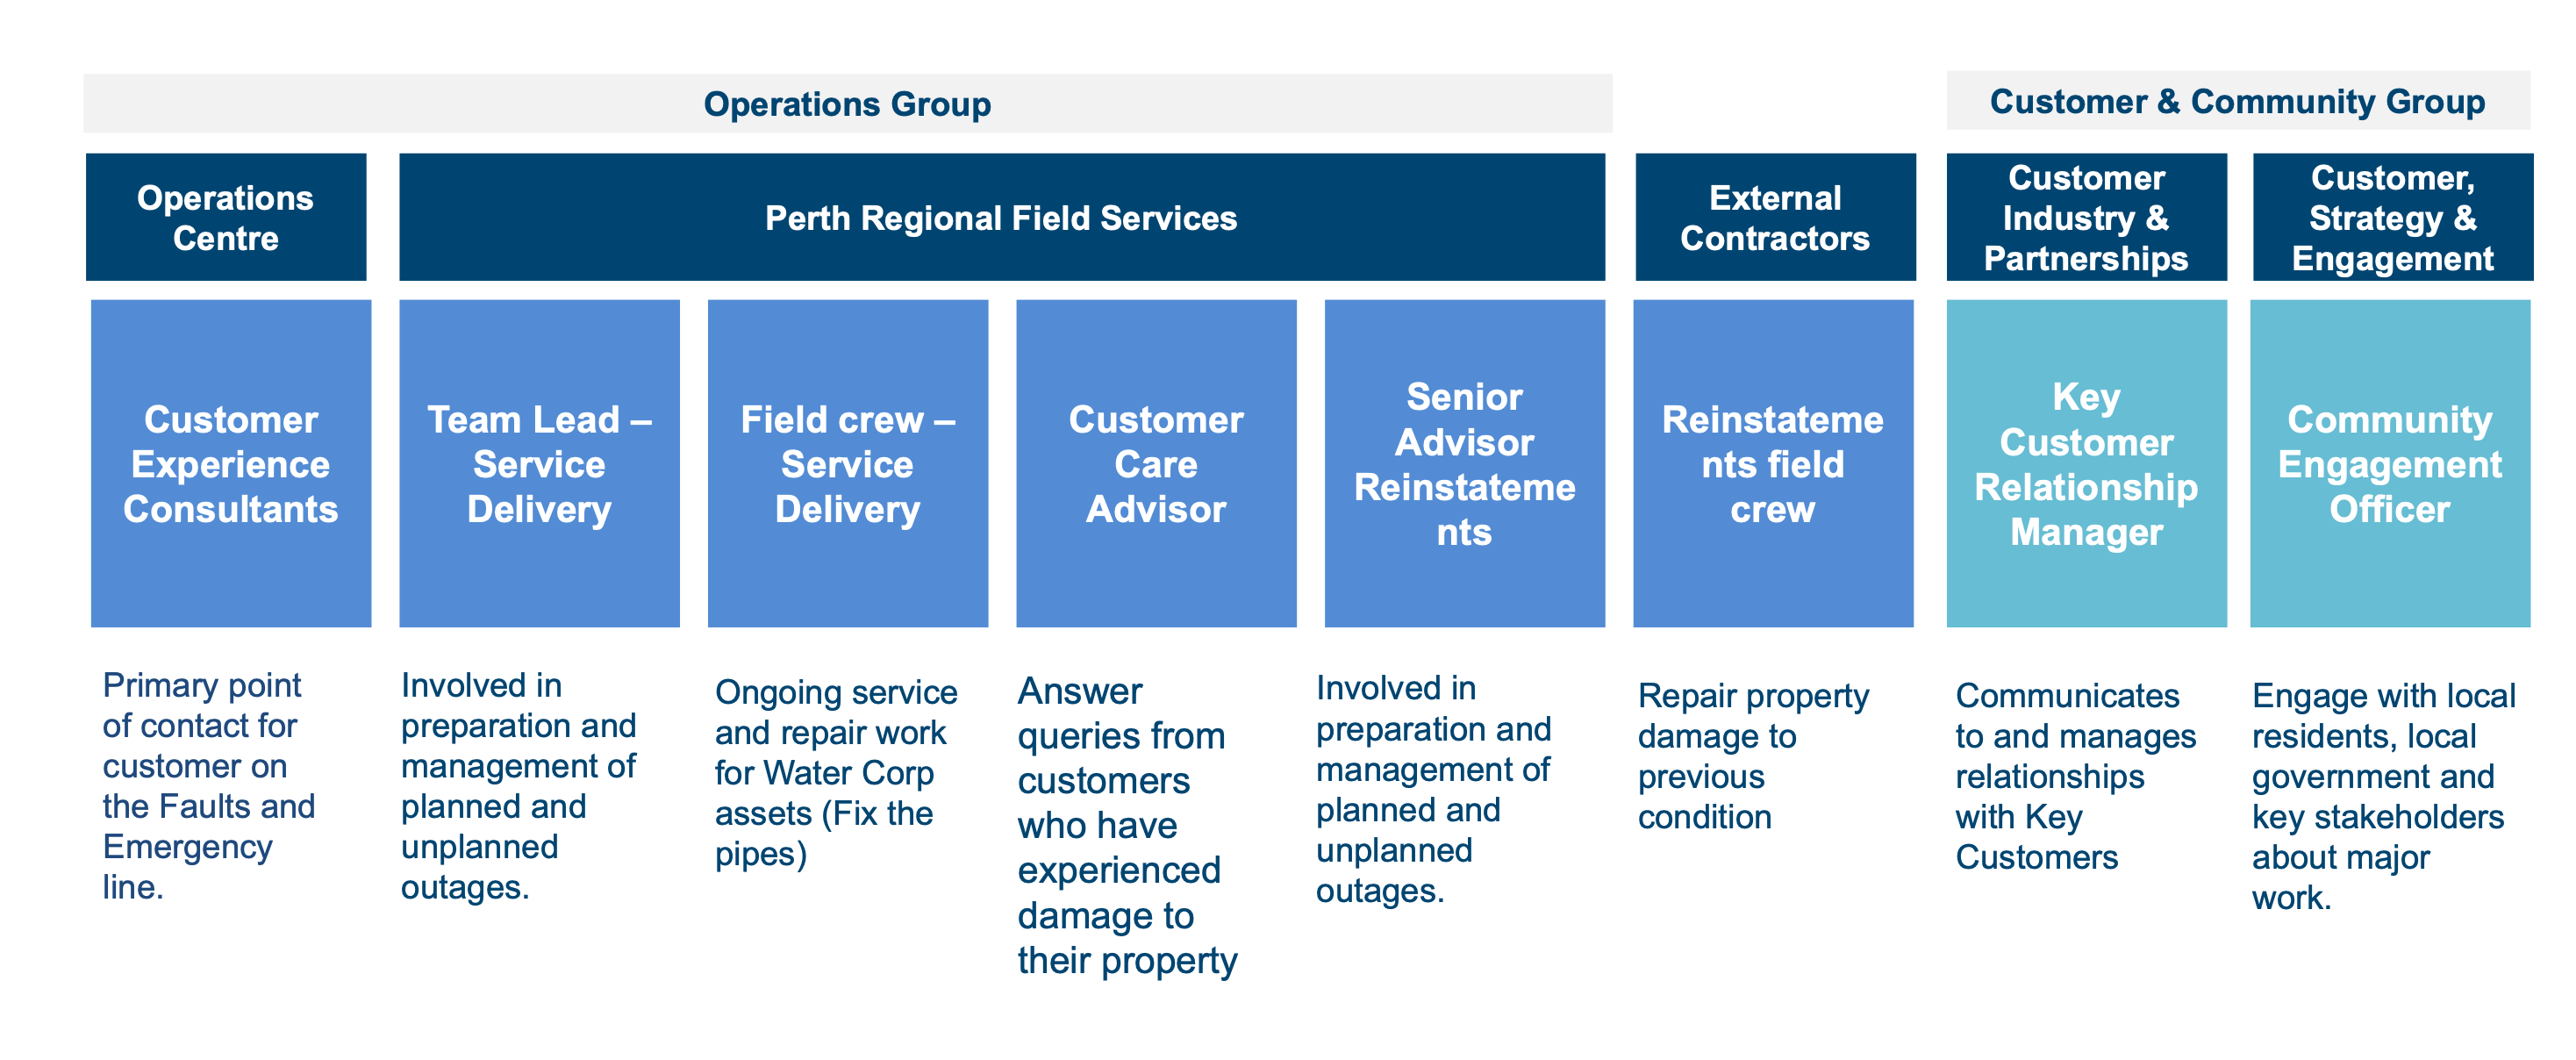
During this discovery I identified the key teams involved in delivering an outage experience. Across two groups, at least eight distinct roles touched an outage. Each team dealt with different systems, were led by different KPIs, and had varying definitions of success.
Stakeholder map
8 roles across Operations Group and Customer & Community Group - each with different systems, KPIs, and priorities
THE CUSTOMER EXPERIENCE
Mapping the customer impact
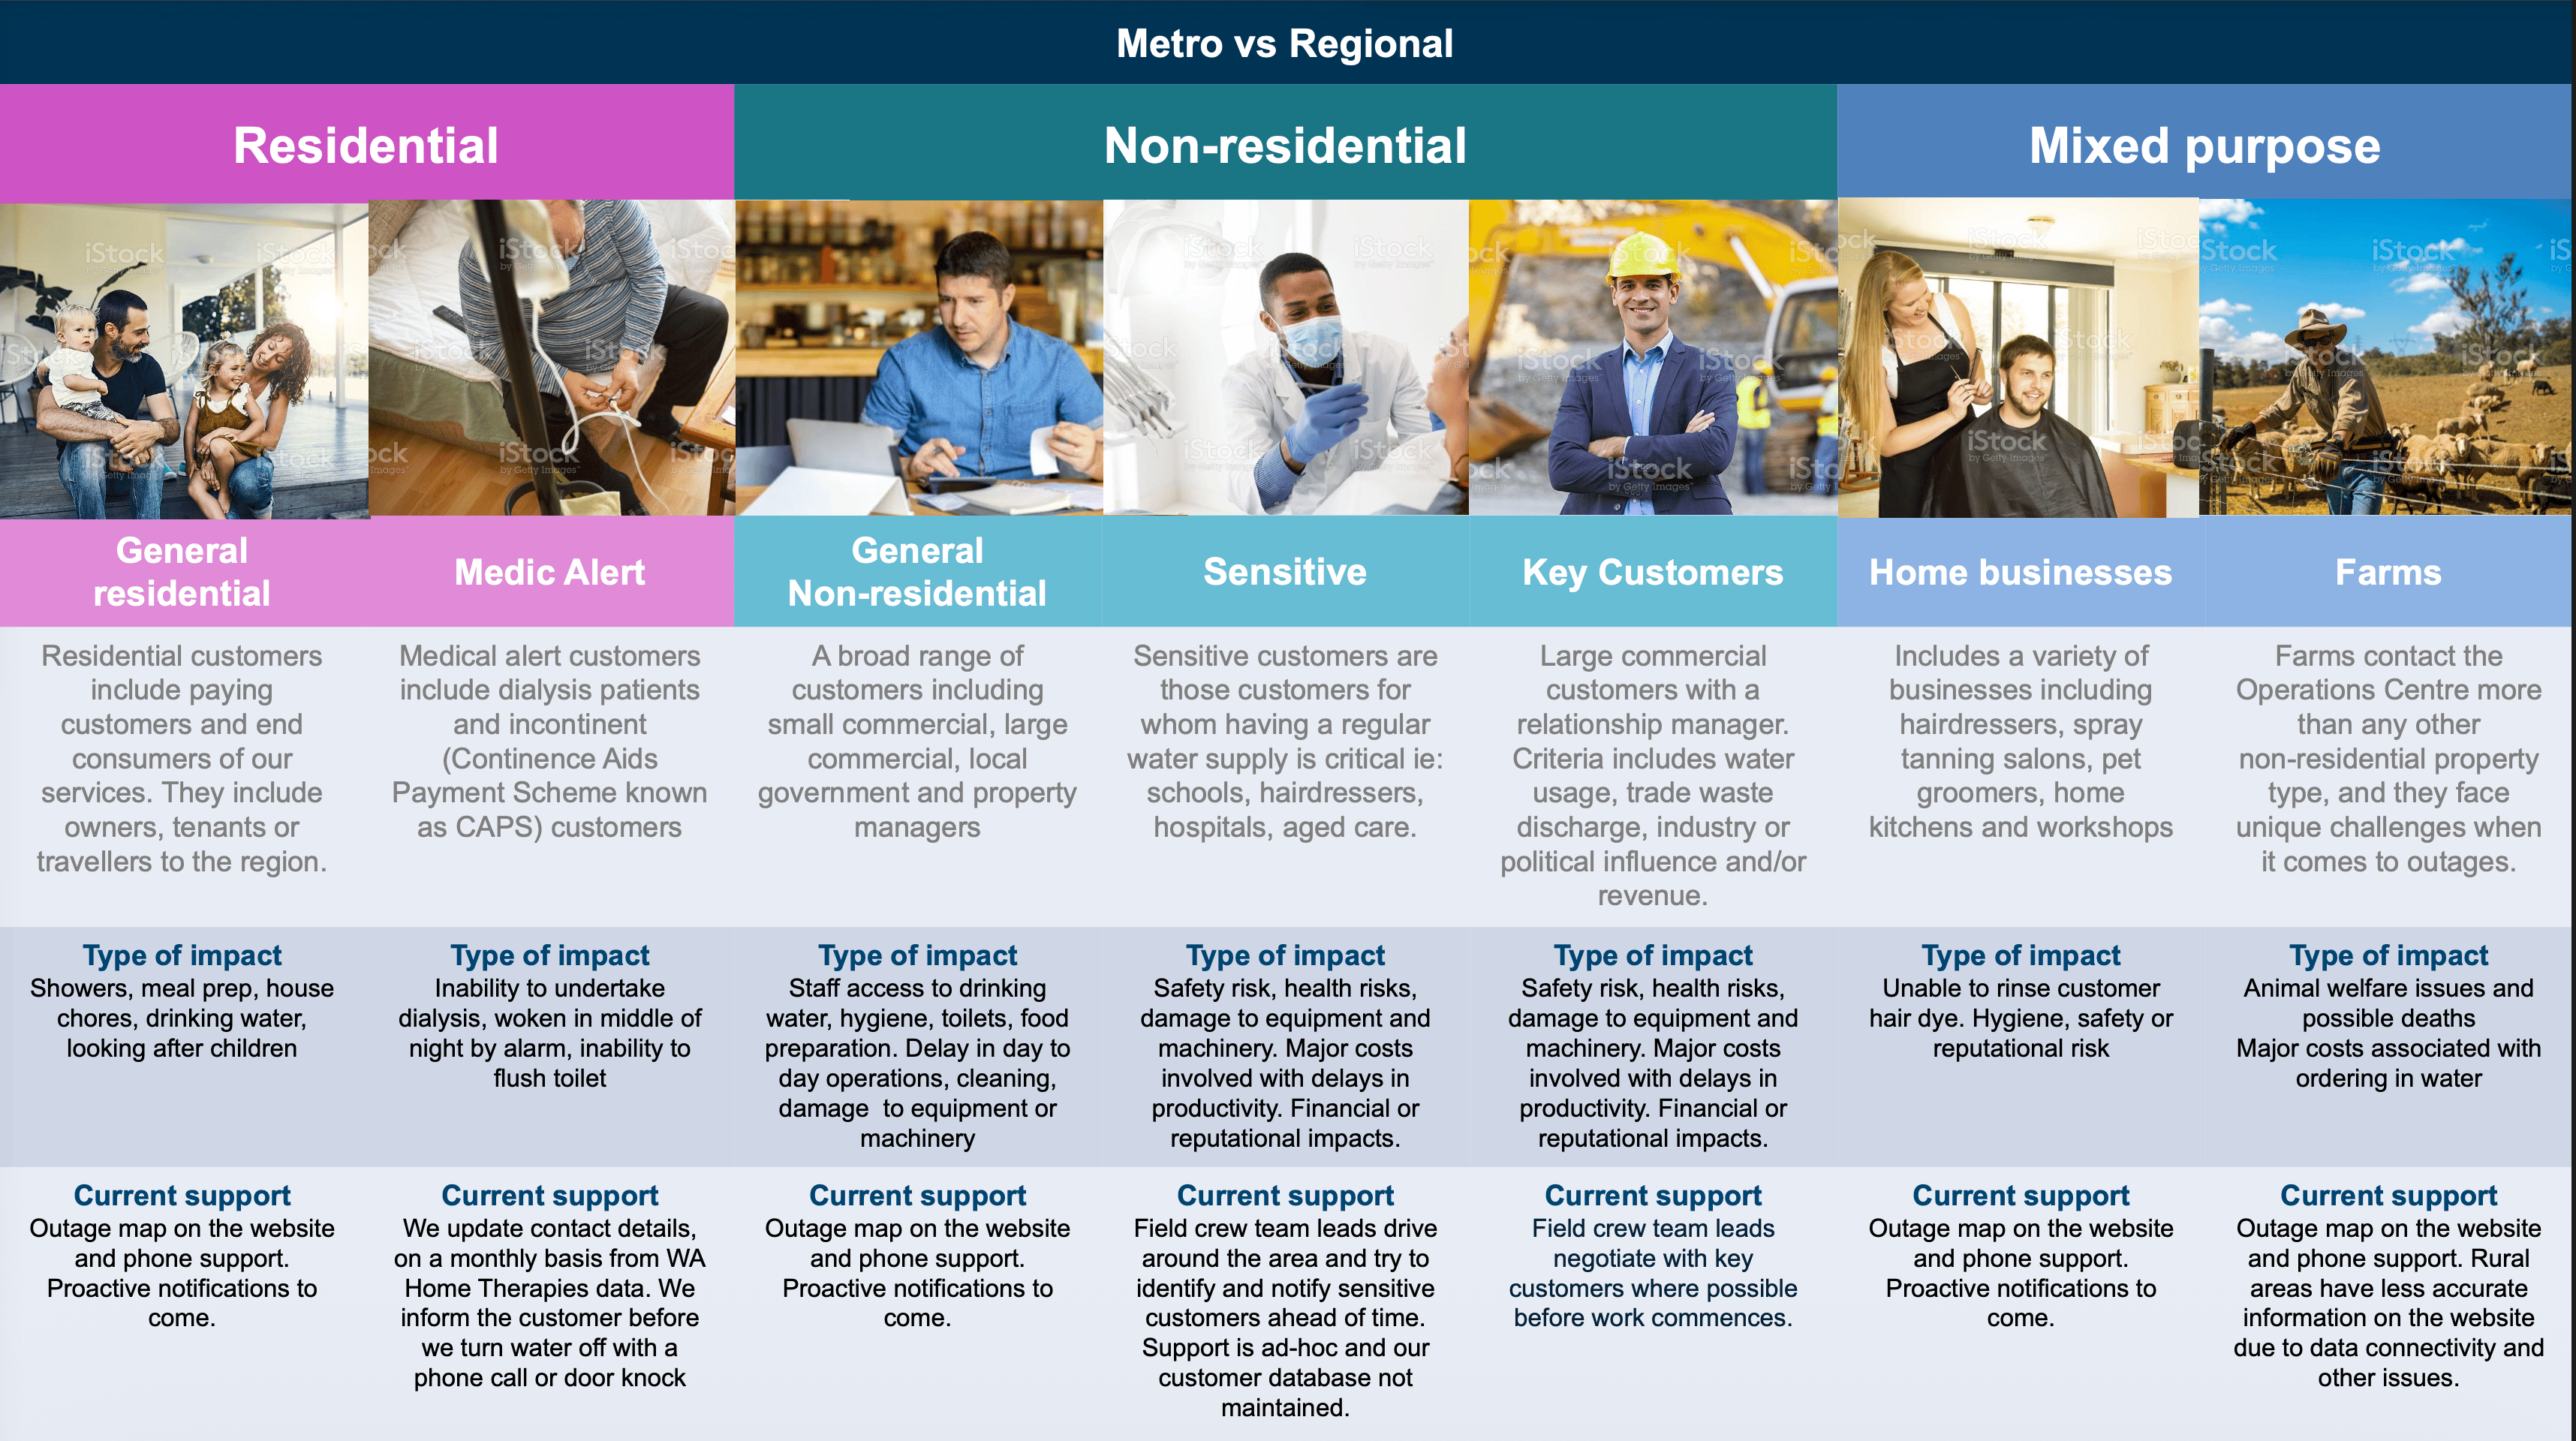
Combining insights from customer facing teams, desktop research and two quantitative surveys, we created a simple impact map for our broad customer segments.
Customer type map
7 segments - General residential, Medic Alert, Non-residential, Sensitive, Key Customers, Home businesses, Farms - each with distinct impact profile and current level of support
KEY FINDINGS
What the research revealed
We uncovered several issues that were previously unknown to the business both above and below the line of visibility. It seems technology was the biggest bottle neck for internal teams.
INVISIBLE TO THE ORG
The outage expansion problem nobody knew about
‘Officially’ 2% of outages result in expansions - where a broken valve forces crews to shut off a different valve and affecting significantly more households. The internal estimate is closer to 40%. No team outside field operations were aware of this figure because there's no friction-free way to report a broken valve so the data never made it into the system.
INVISIBLE TO THE ORG
Work arounds for clunky internal systems
Call centre staff use Outlook as a work around to track outages because the dedicated outage management software was far too slow. Outlook allowed them to track calls and jobs in real time, but it meant every job was updated in multiple places, which added time to each job and risks in double-handling and missing an update.
SYSTEMIC FAILURE
Customers were rarely notified about unplanned outages
During a planned outage, customers would receive a letter in their mailbox 48 hours before their water turned off. When 85% of outages are unplanned, and not logged until a few hours before, or sometimes after the water turned off, customers were left without warning. Without this notification, customer impact increases significantly.
HUMAN TENSION
Field crews were set up to fail
"There's water going everywhere and you're trying to get the PDA to load. It takes ages and a minute feels like forever when you're out there."
Before touching a single pipe, a field worker had to call the Operations Centre, provide water on/off ETAs, locate the correct valve on a PDA that took minutes to load, check for nearby sensitive customers, and update the system. All while water floods around them, creating risks to their safety and those around them. Sometimes while being abused and yelled at by residents. The process wasn’t designed for the real circumstances.
SYSTEMIC FAILURE
‘Sensitive’ customer lists 10 years out of date
The organisation talked about "sensitive customers" as a defined group receiving special care. These included dialysis patients, dentists, doctor’s surgery. In reality, the lists were over a decade old, the category didn't formally exist in the customer database, and the level of care depended entirely on which crew showed up. With preserved supply numbers set to grow from ~100 to potentially 3,000 customers, this was urgent.
HUMAN TENSION
Leadership and frontline had never been in the same room
Senior leaders cared about costs and satisfaction scores. Operations Centre staff and field crews cared about immediate safety. Both had rational, well-intentioned priorities - and they had never been brought together to understand how those priorities created friction. The blueprint was the first time both perspectives existed in the same artefact.
THE ARTEFACT
The service blueprint
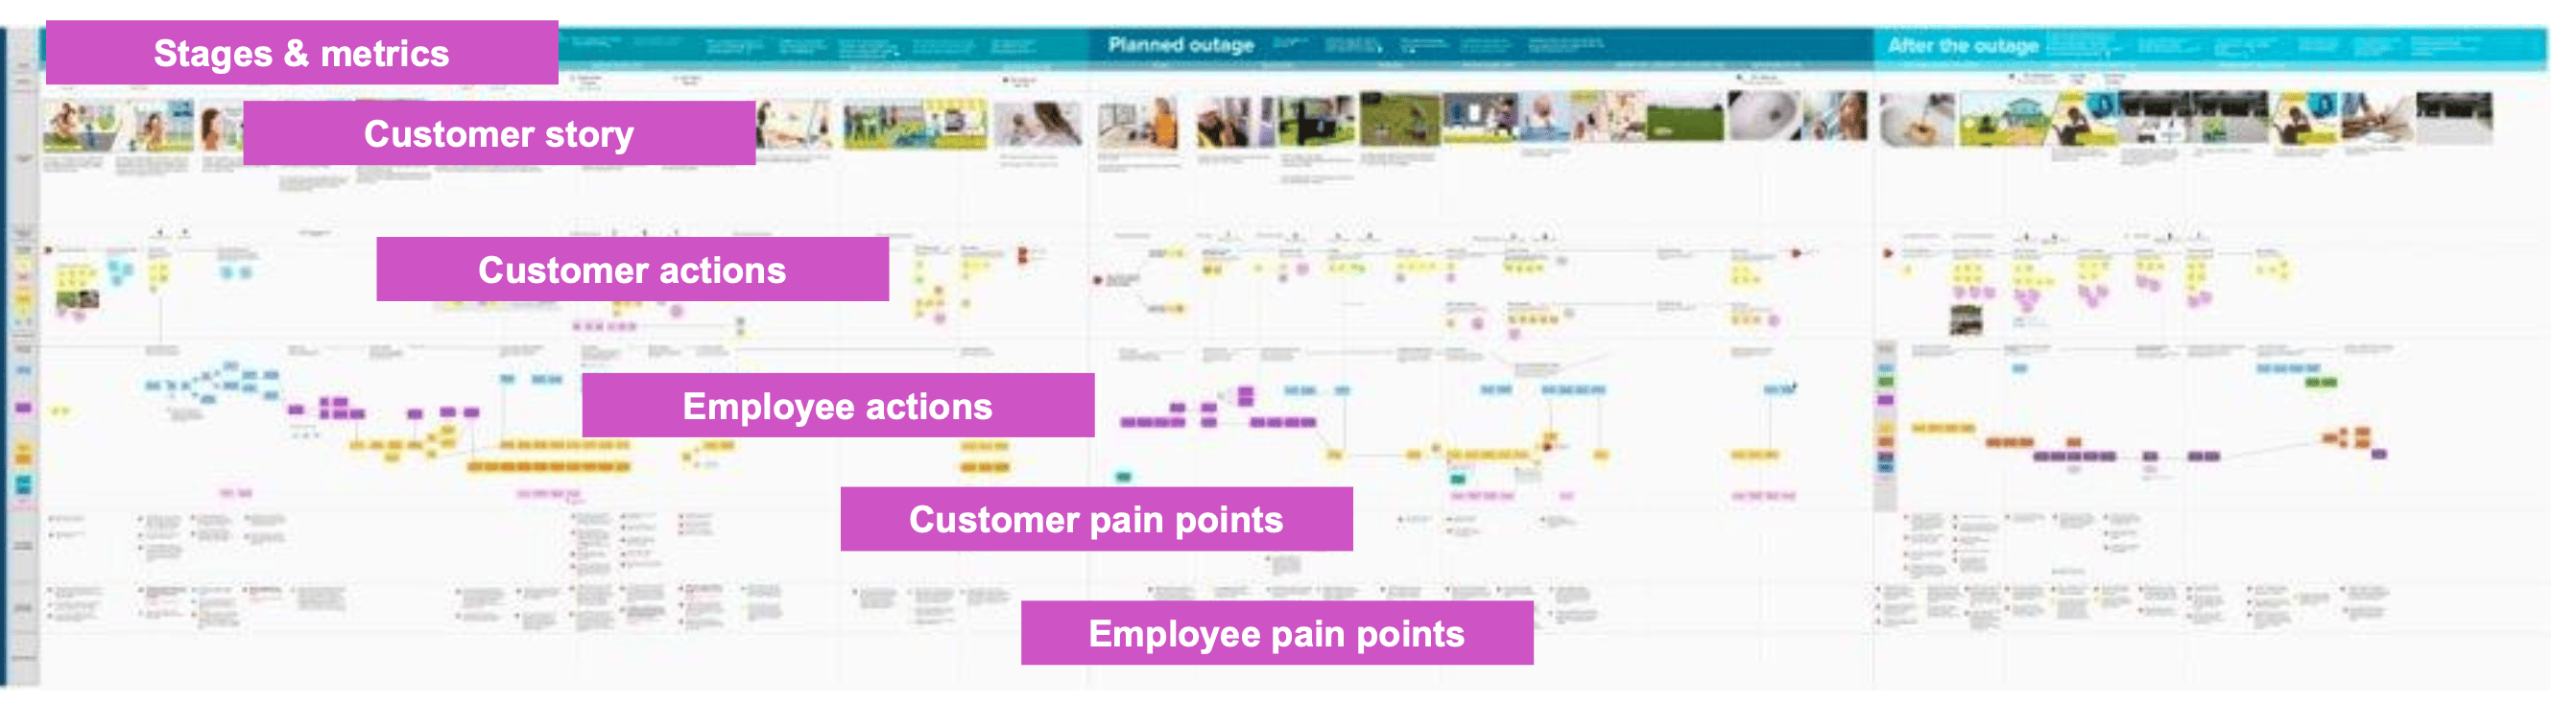
The blueprint mapped the full outage experience across three phases - unplanned, planned, and after the outage, showing the customer journey running parallel to the actions of every internal team. A ‘line of visibility’ separated what customers could see from what was happening behind the scenes.
The blurry blueprint
(For privacy reasons, I’m not able to share the high-res version)
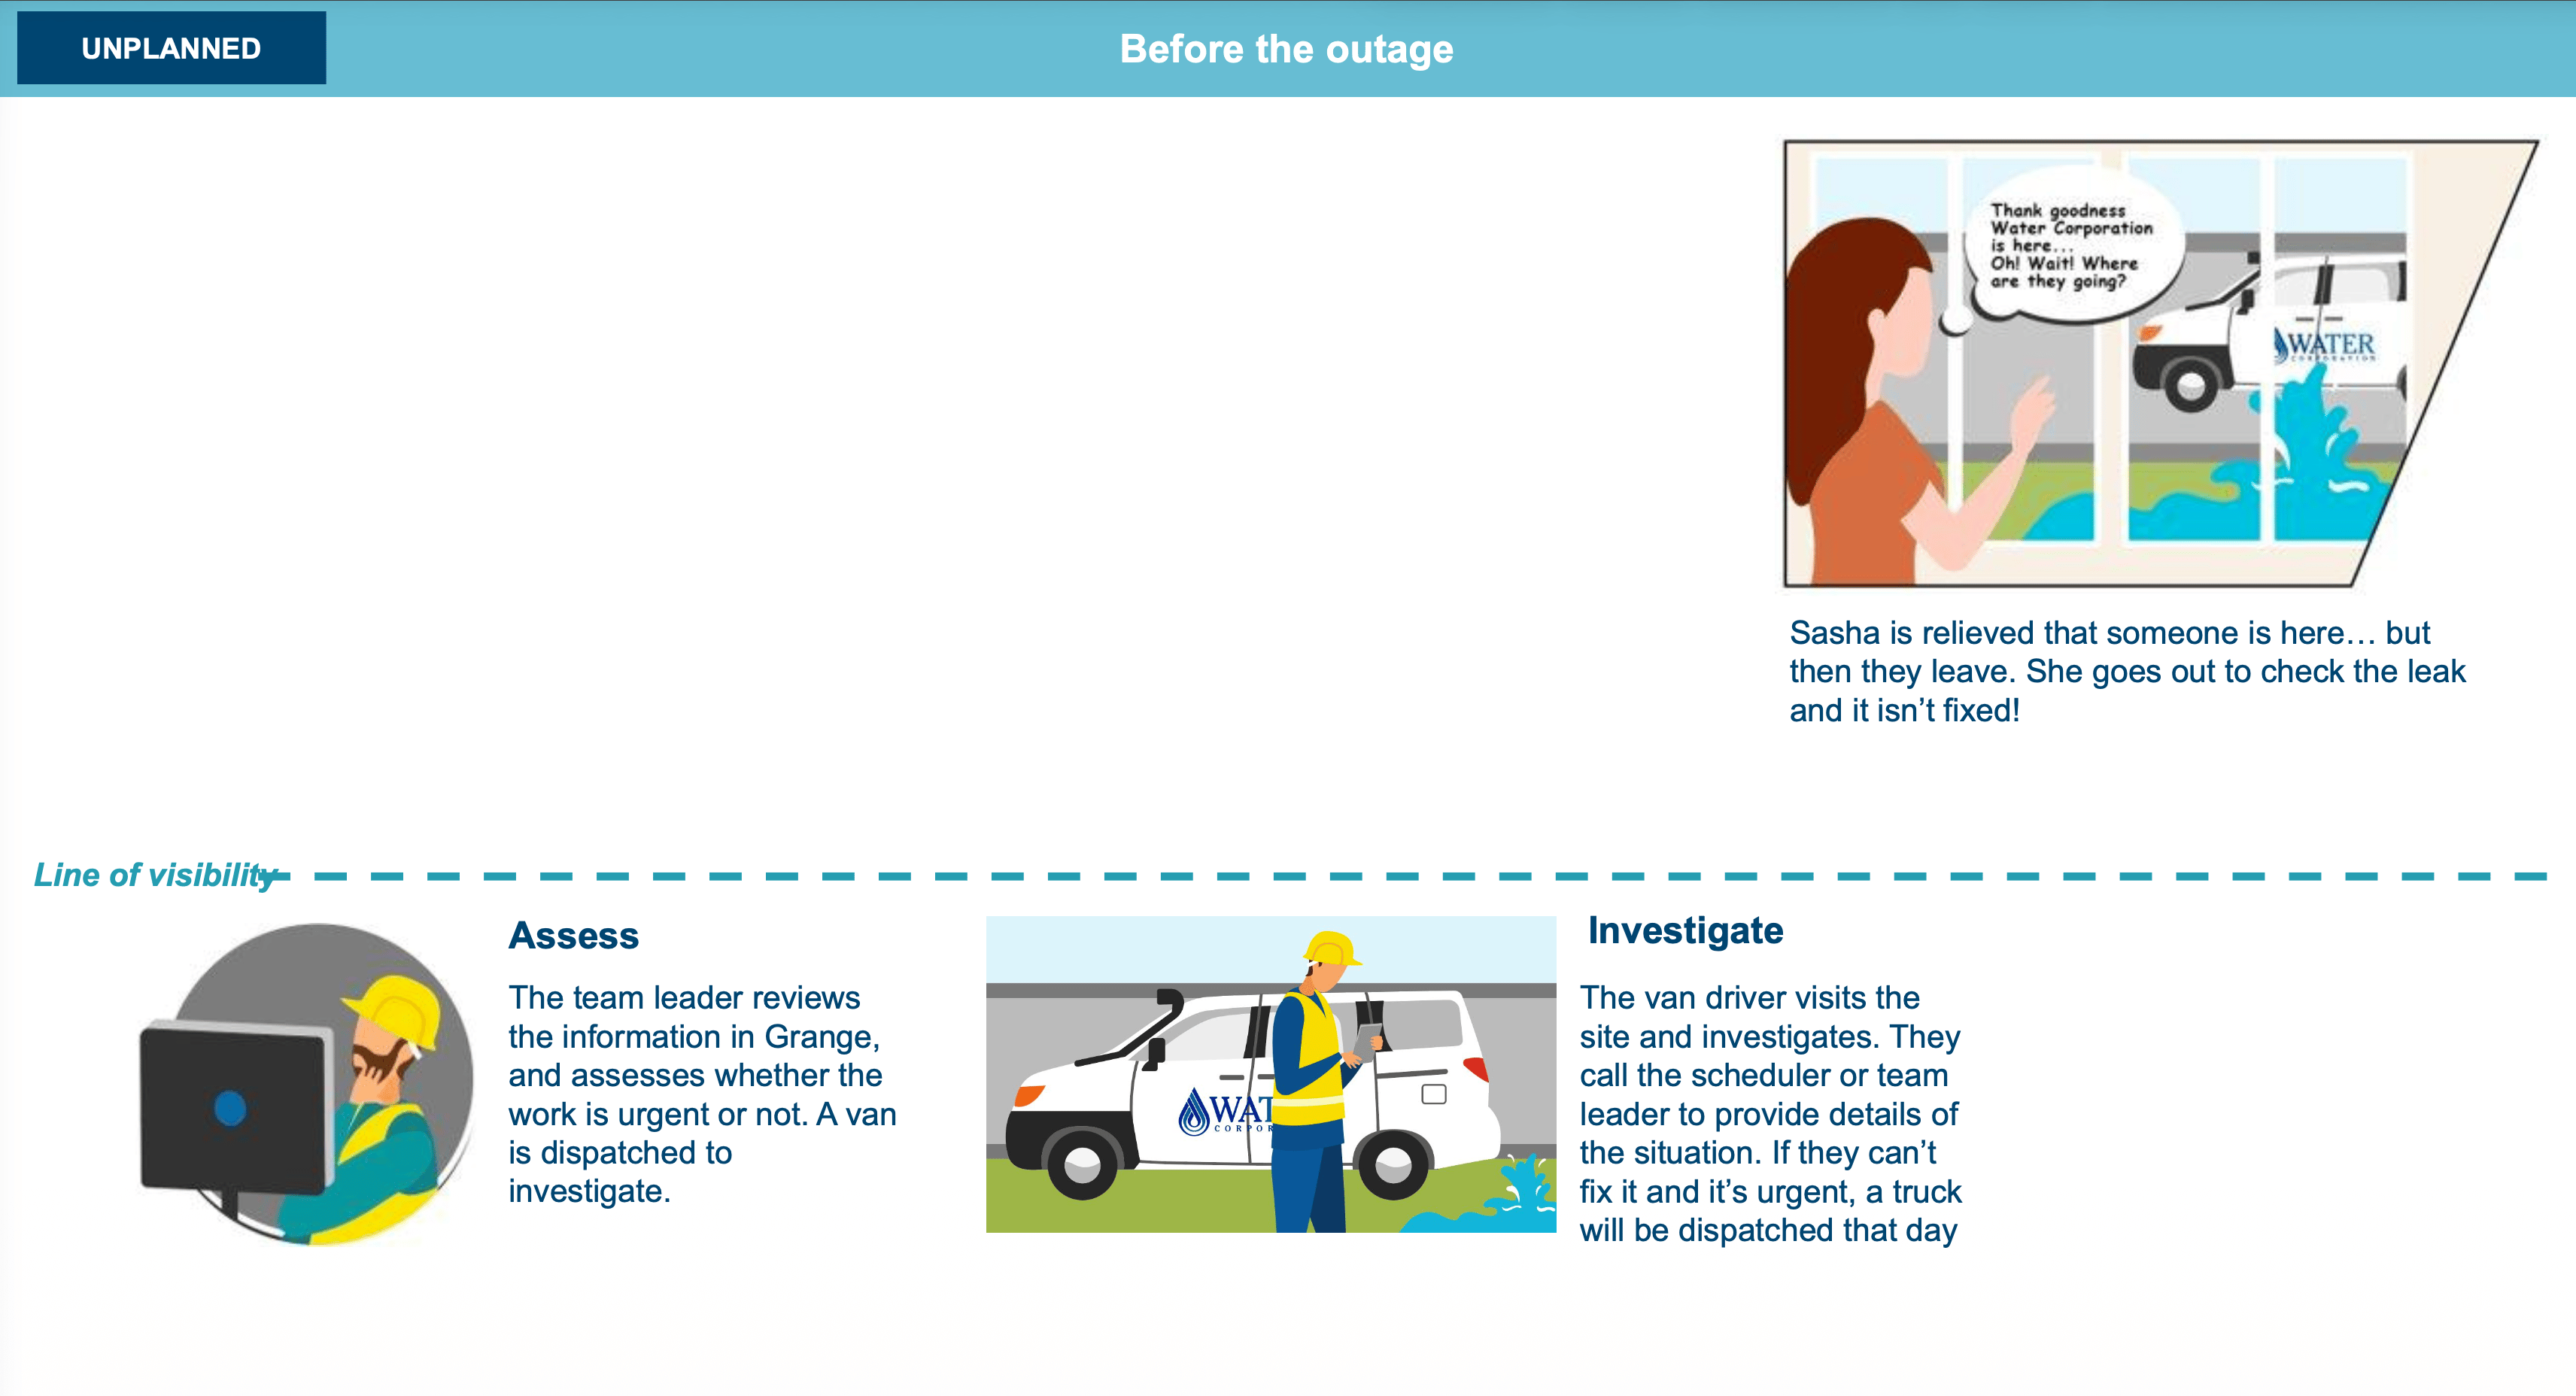
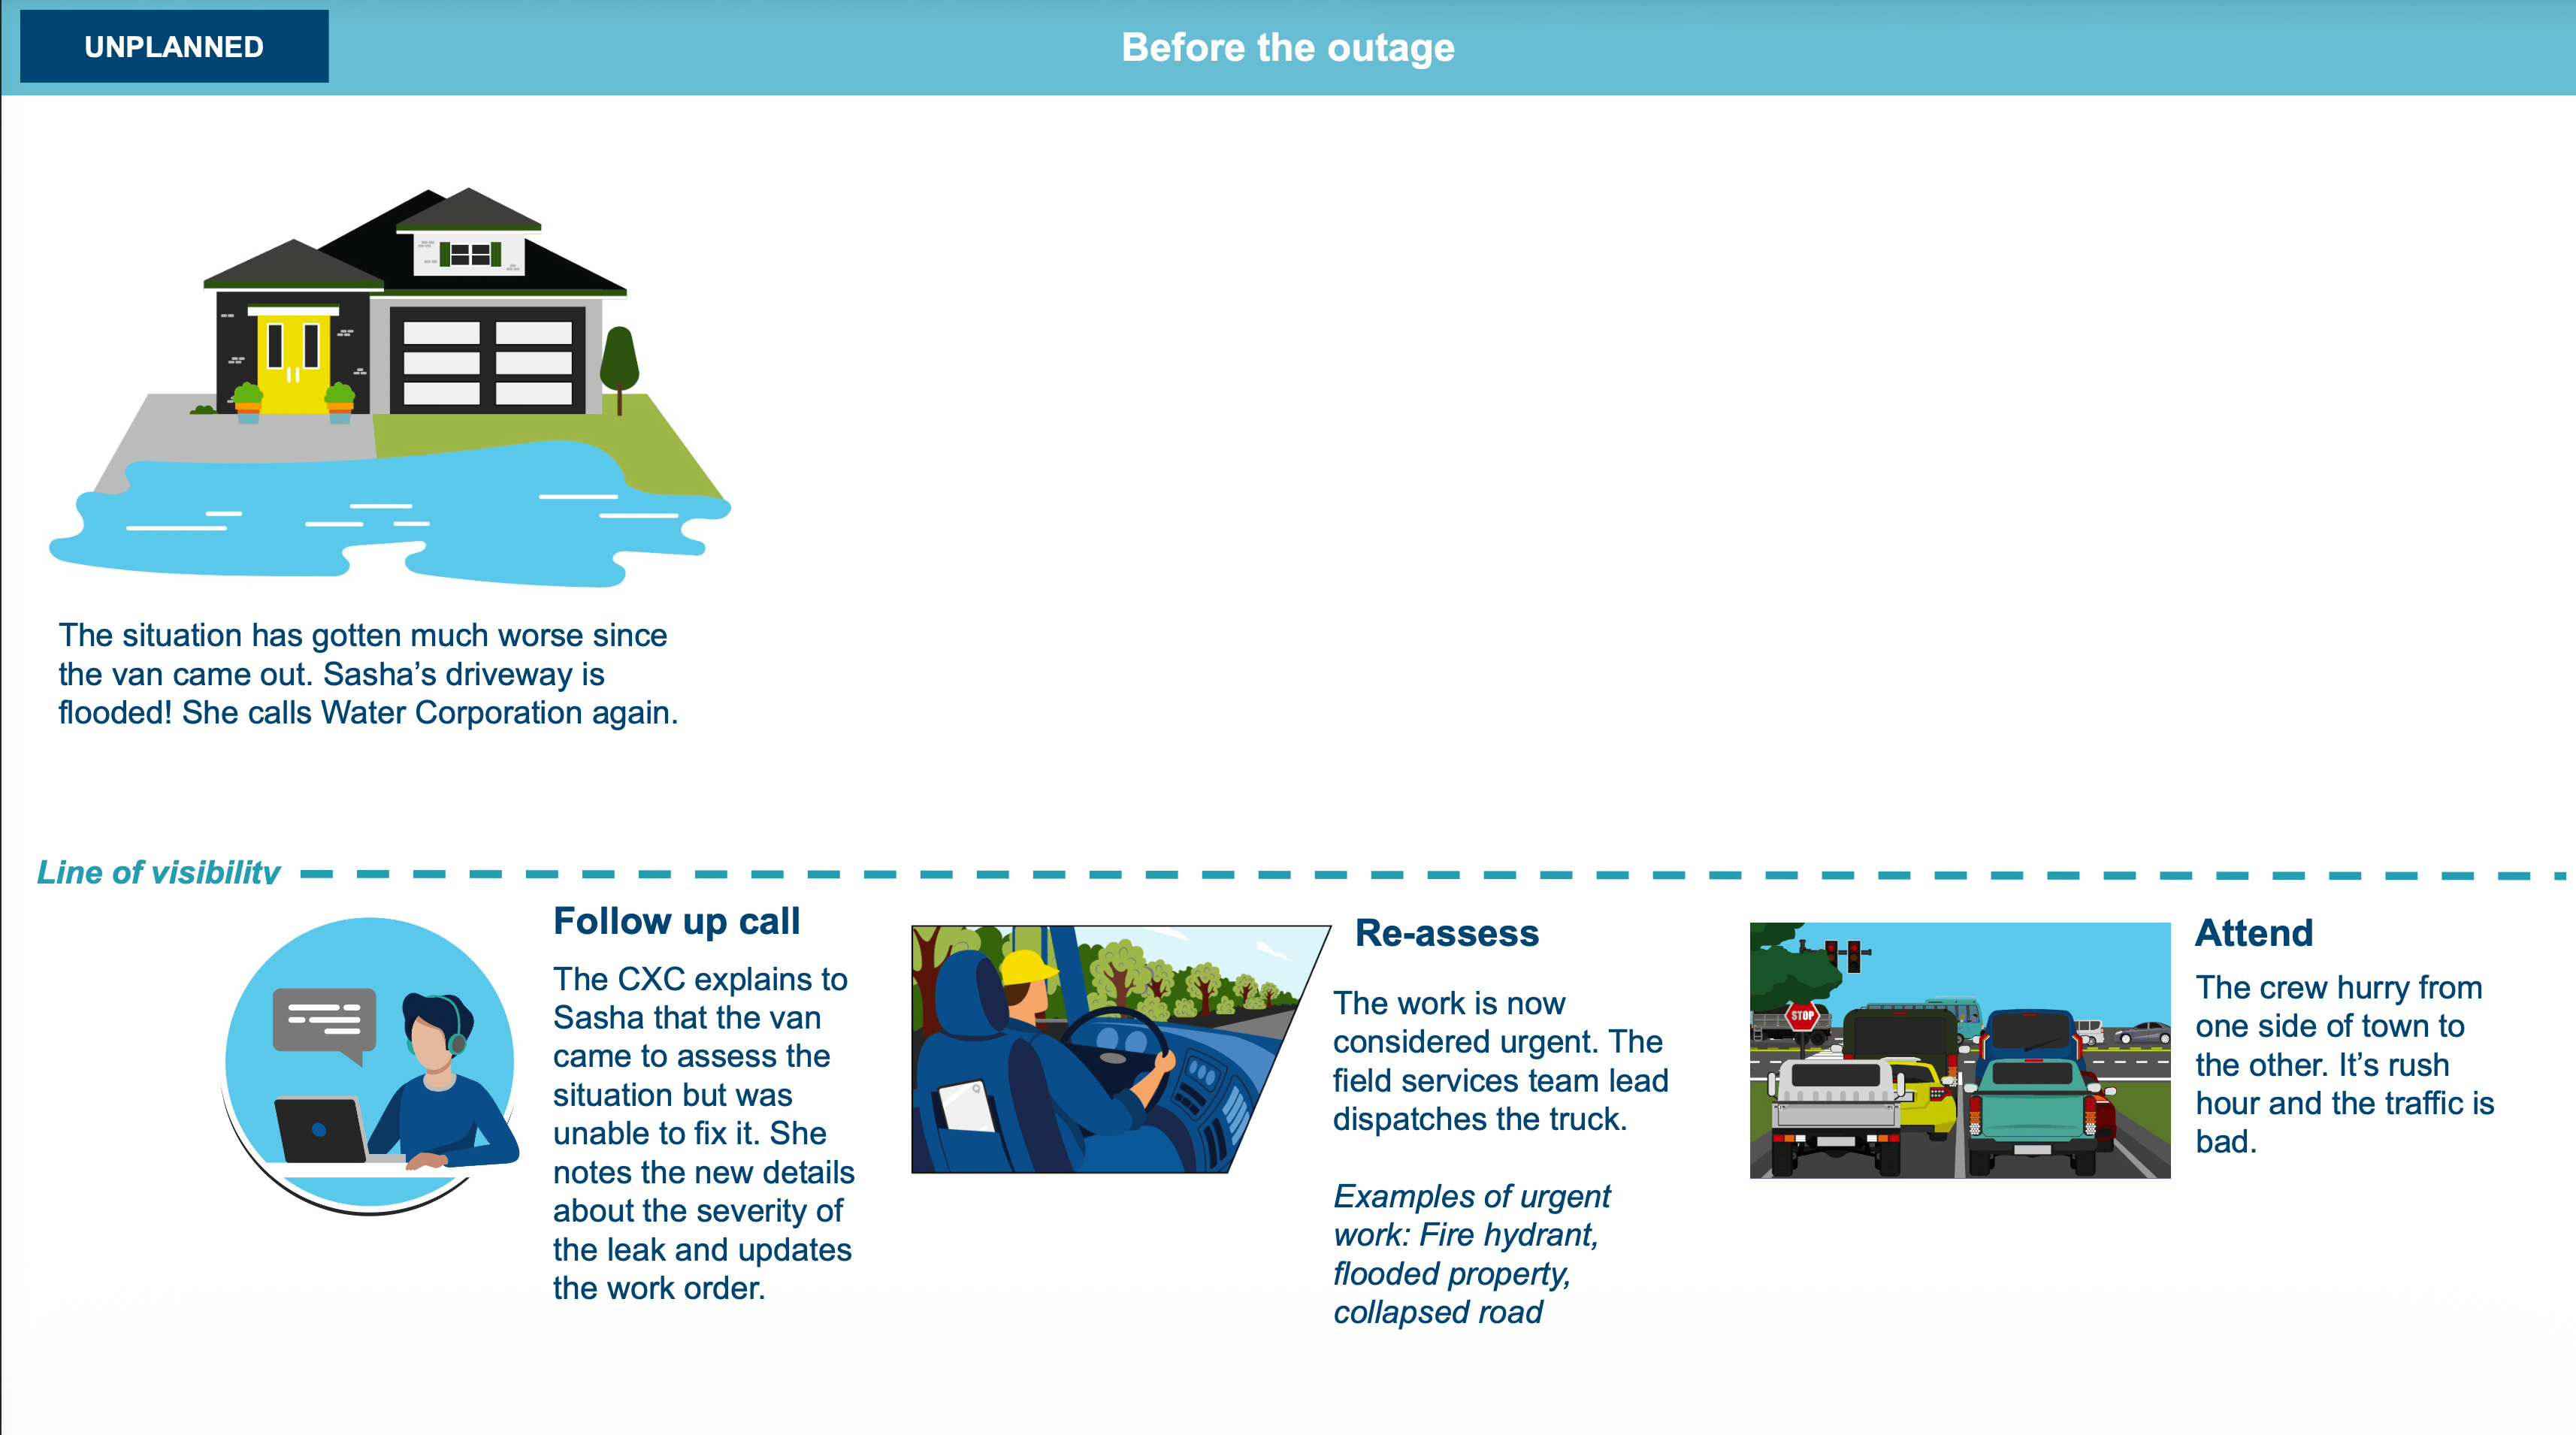
Storyboard panels
Key moments from the blueprint brought to life through illustrated scenarios, showing the human reality on both sides of the line of visibility.
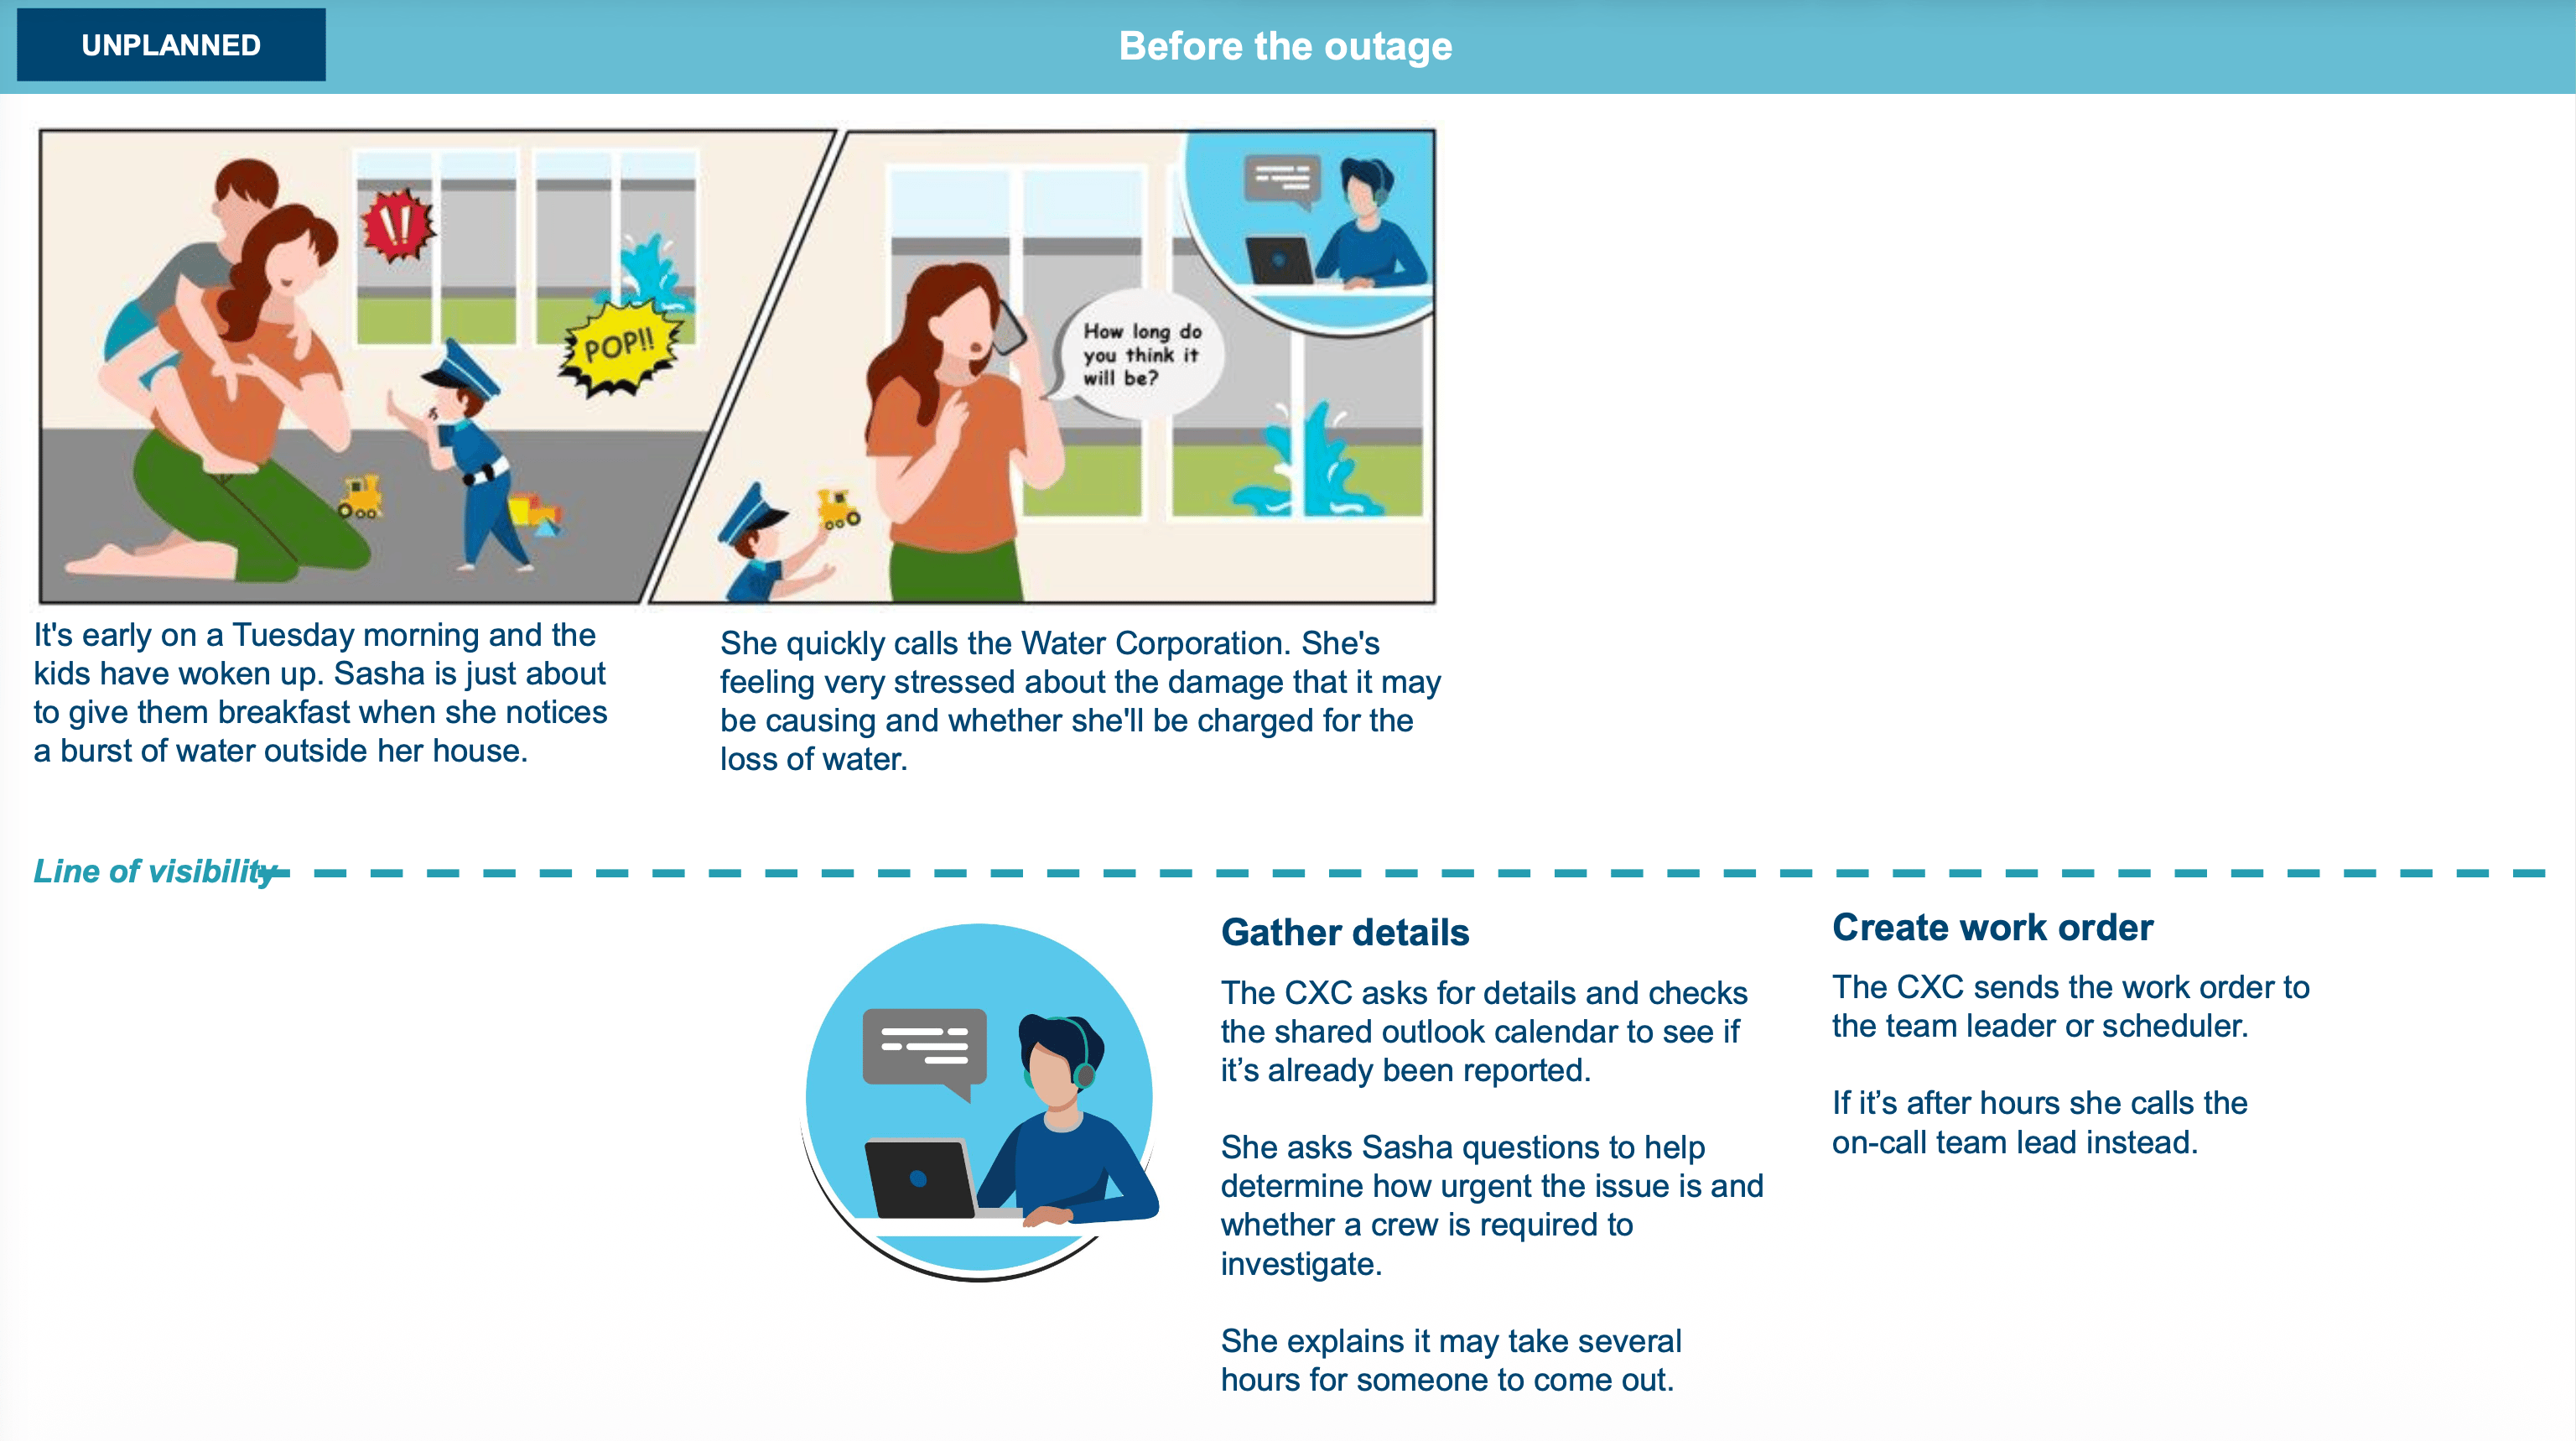
Storyboard panel 1. Sasha calls Water Corp
Storyboard panel 2. Crew dispatched in rush hour
Storyboard panel 3. Arrive, create outage, locate valves
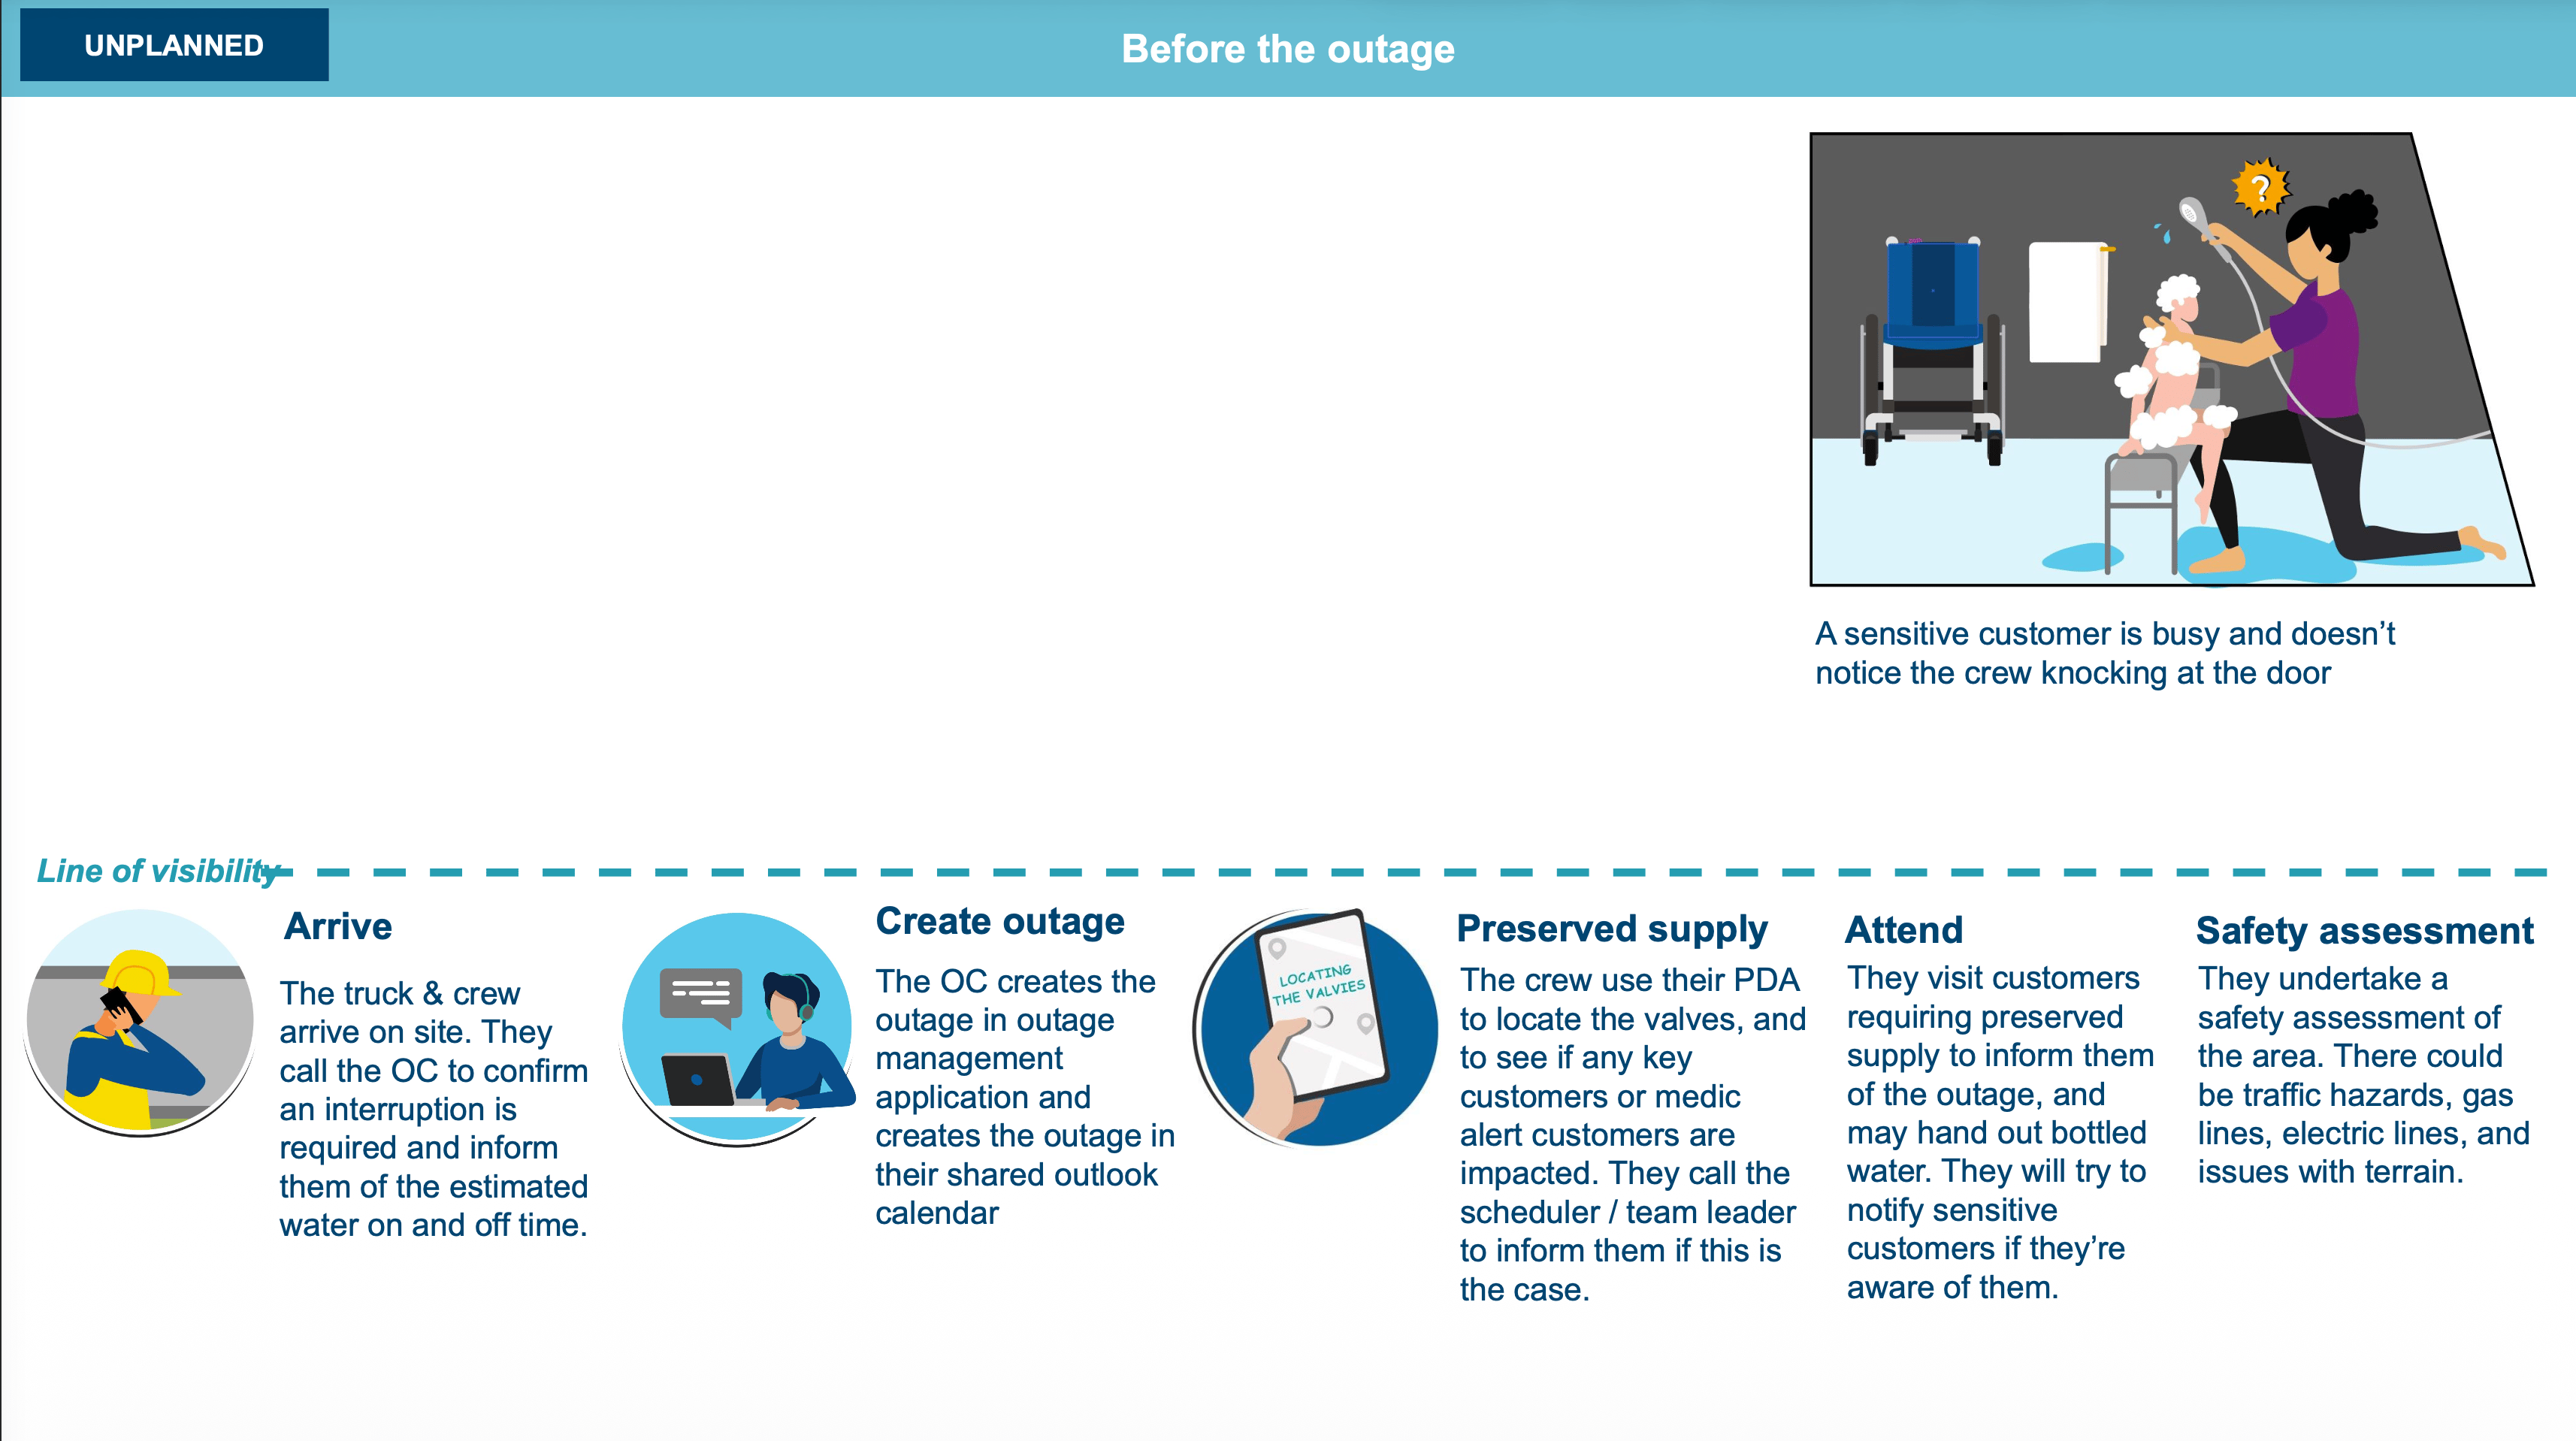
Storyboard panel 4. Carer and shower scene (sensitive customer)
PRIORITISATION
19 problem statements, one very revealing workshop
After synthesising the research, I wrote 19 problem statements - one for each major pain point. I named them like characters, not jargon: 'The Expanding Expansion Problem.' 'The Outage Surprise.' 'The Slow PDA.' This made them easier to understand for everyone in the room by succinctly capturing the key problem.
I ran a prioritisation workshop with reps from every team. Customer value on one axis, business value on the other, implementation effort as a third lens. The scores were assigned by the SMEs in the room, with the feasibility layer added at the end to uncover true business value.
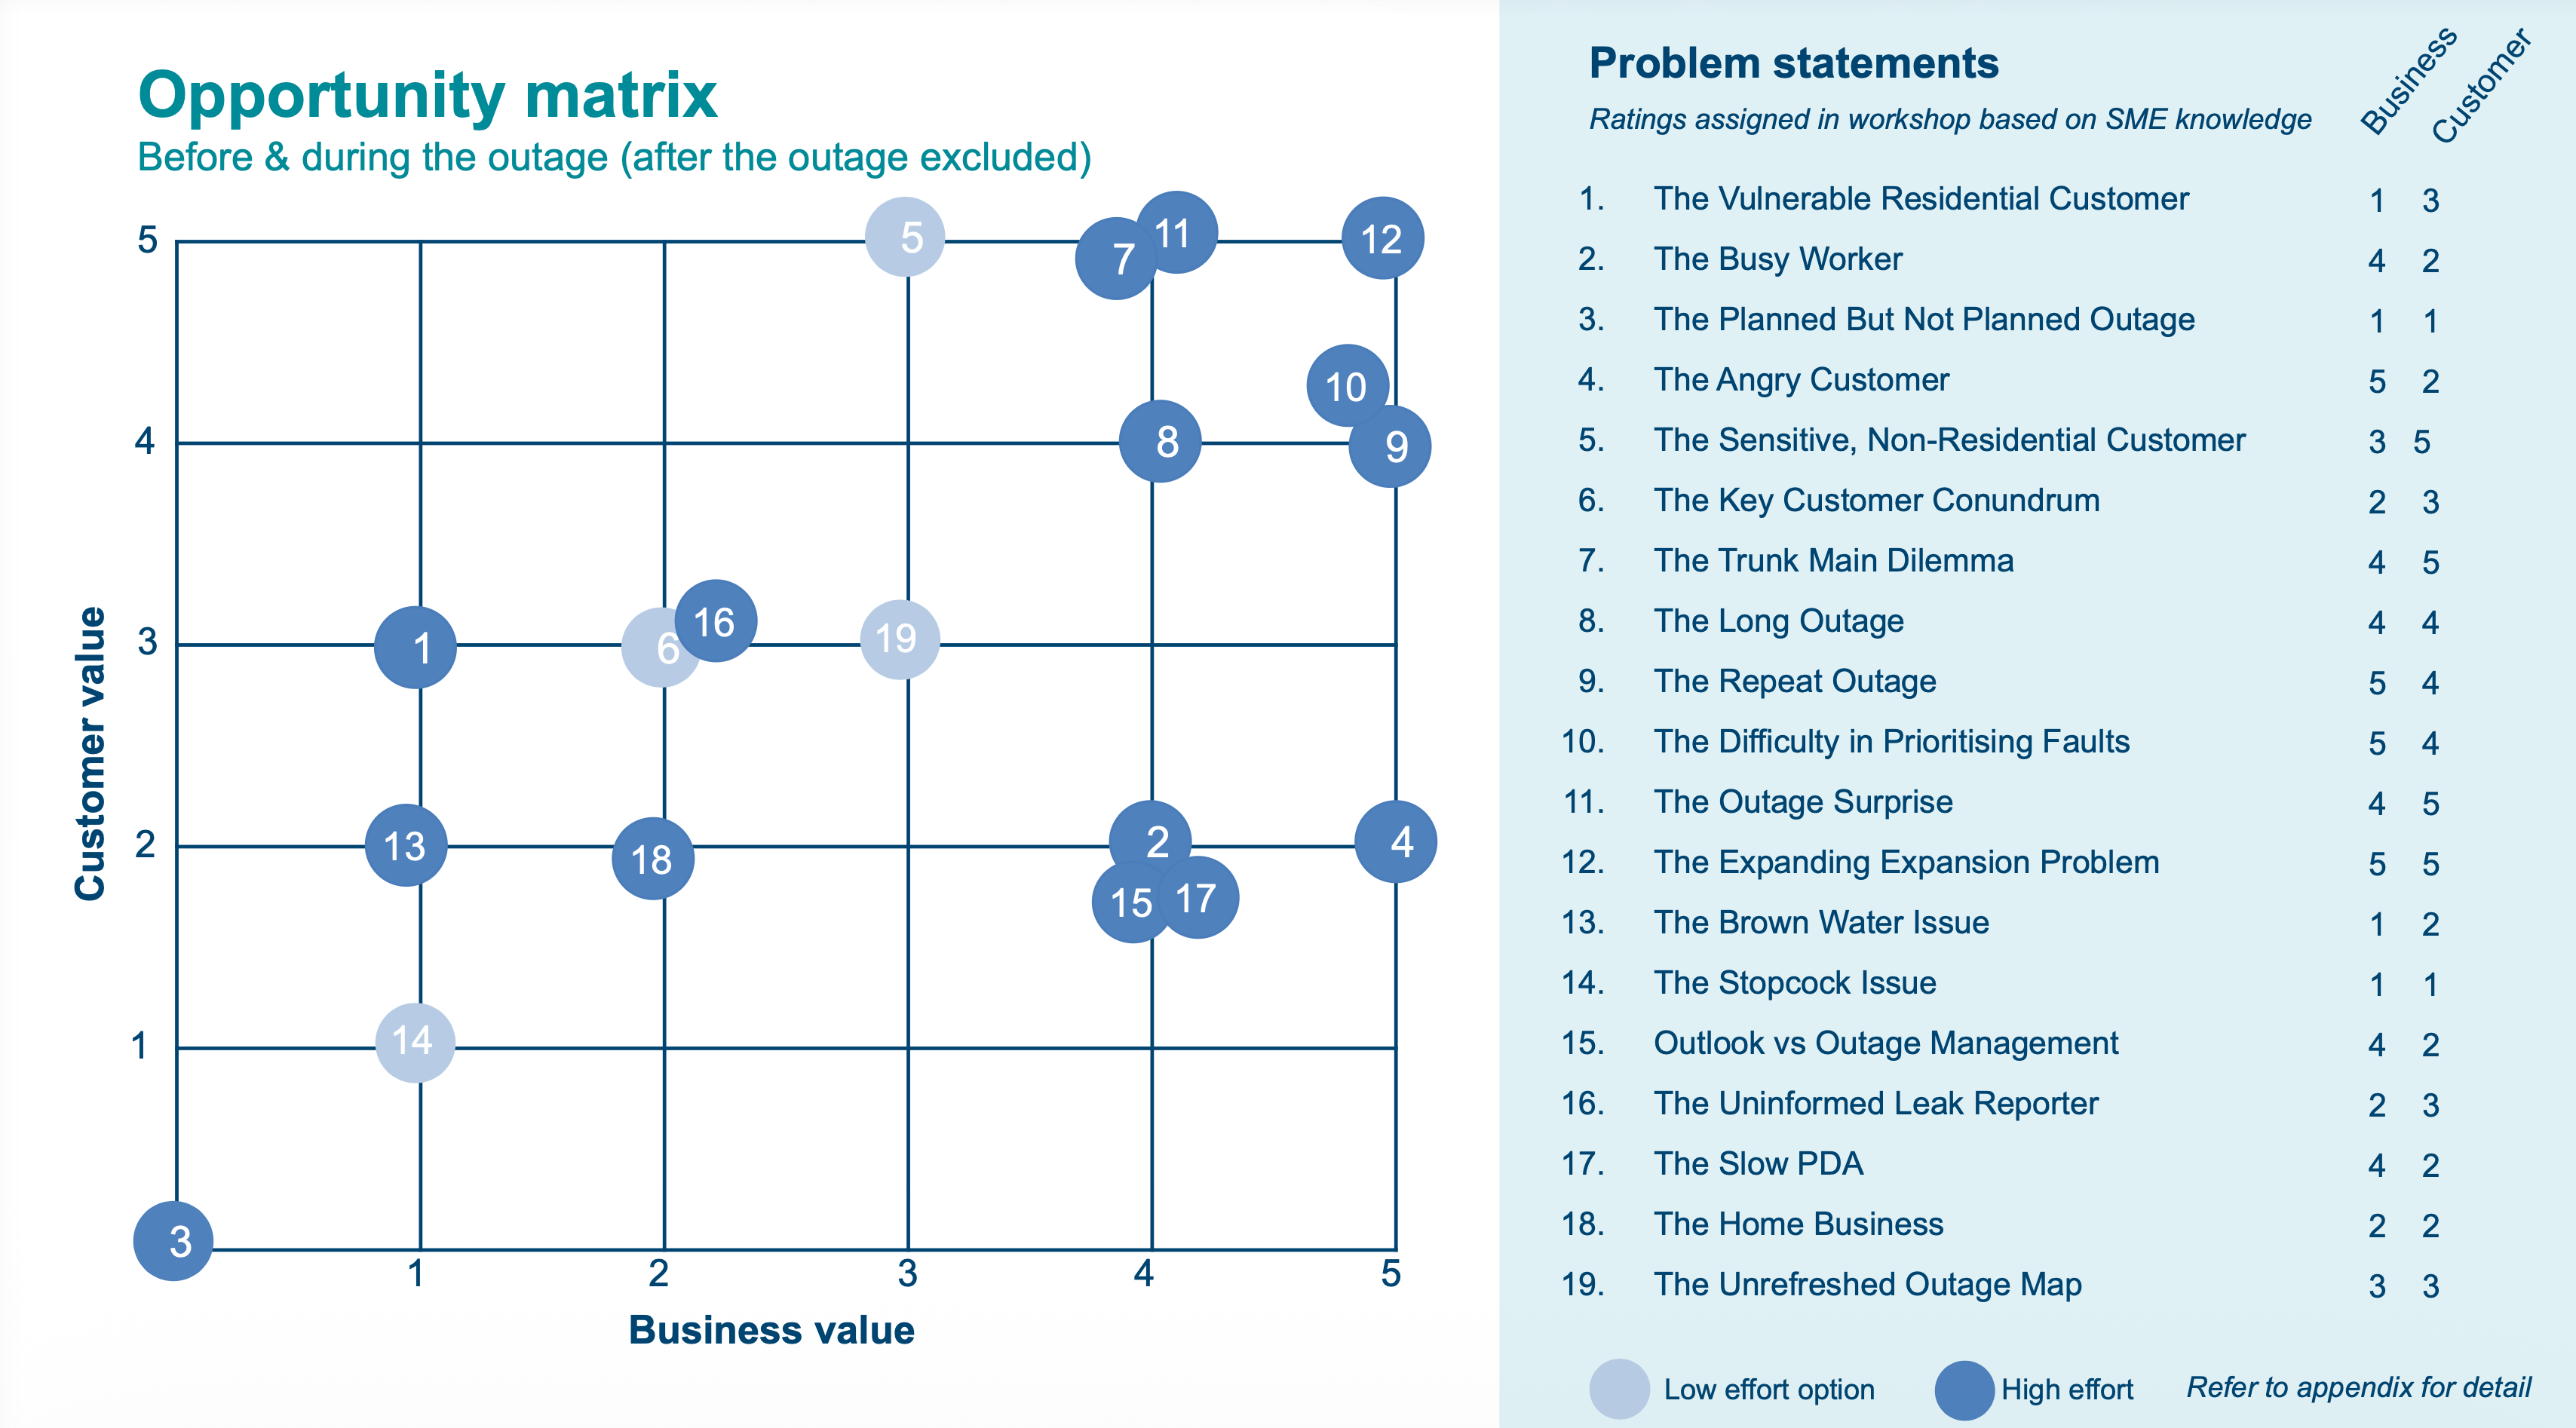
Opportunity matrix
19 problem statements plotted by business value (x-axis) and customer value (y-axis), scored by SME workshop participants.
Key problem: ‘The Expanding Expansion’
Scored 5/5 on both axes, the only statement to do so.
A problem that had been absent from every report, now sitting at the top of the matrix. Unofficially 40% of all outages impact more households than anticipated I watched senior stakeholders reckon with something they'd had zero visibility of. This was a key moment of the project and helped us reframe our focus for the next phase.
RECOMMENDATIONS
What I recommended and what happened
01
QUICK WIN
Opt-in outage notifications via SMS and email
Move beyond the letterbox slip (which customers rarely noticed) and give people the option to receive alerts via SMS or email, promoted through bills and existing communications. Acknowledge honestly that 85% of outages would still be unplanned, but they would at least be notified the moment the outage entered the system, which could give them the notice they need to prepare.
Outcome
The team launched an opt-in SMS system six months after the project, reducing contact centre load and improving satisfaction scores.
02
LONG-TERM
Redesign the field crew PDA experience
The PDA "water off" trigger was the critical data point for every downstream notification and system update - but it was slow, cumbersome, and used in the most stressful moments of a crew's day. I recommended exploring an audio prompt, a two-person process, or a simpler interface to make the update reliable. Reducing friction here would cascade across data accuracy, customer comms, and the Outlook workaround.
Outcome
The team launched upgraded their PDA’s to access the 4G network meaning it’s now quicker to locate the valve and send updates to internal systems.
03
LONG-TERM
Invest in proactive asset management and leak detection
The volume of unplanned outages was a symptom of ageing infrastructure and poor visibility. I recommended exploring technology that could identify pipe stress before failures - through usage spike monitoring or physical sensing.
Outcome: The Leak Detection Program + 17% reduction in outages
In 2023, Water Corp launched a fibre-optic sensor program to detect leaks before they become bursts. The 17% reduction in pipe failures between 2020 and 2022 reflects the broader shift this project helped initiate.
04
LONG-TERM
Replace the outage management system - or honour the workaround
The Outlook calendar existed because the official systems couldn't keep up. Team leads had already tried and failed to eliminate it. I recommended finding a replacement or supplement that met staff where they were, something fast, reliable and updates in real-time. The root cause of the workaround was legitimate and the organisation needed to work with their staff to co-design a solution fit for their needs.
05
QUICK WIN
Standardise the sensitive and preserved supply customer process
With the preserved supply list about to grow from ~100 to potentially 3,000 customers due to incoming CAPS legislation, inconsistency in vulnerable customer care needed urgent attention. I recommended formally defining "sensitive customer" in the system, establishing clear process ownership, and ensuring the level of care didn't depend on which crew was rostered that night.
REFLECTION
What I learned about working in complex systems
The most important skill gleaned from this project was how to hold complexity without assigning blame. Every workaround I found had a rational reason behind it. The Outlook calendar was genuinely more reliable. Field workers genuinely were safer focusing on the pipe than the PDA. Staff couldn't trust a dashboard that was twenty minutes out of date.
When I presented to senior leadership, I framed the frontline not as the source of the problem, but as evidence of it. These teams were dedicated and resourceful. They'd done what they could with what they had. The onus was on the organisation to build something that worked with its people. Any solution designed without these people just generate a new set of workarounds.
The fibre-optic leak detection program, the SMS notifications, the Dovetail investment, the 17% reduction in pipe failures - they're brilliant outcomes the organisation was finally positioned to pursue, because for the first time, everyone in the room could see what was actually happening.
All projects
Refining My Wellbeing
Designing a product to help students with their mental health.
Read case study →
DesigningResearcher profiles
Helping researchers promote themselves online to increase partnership, global funding and collaboration opportunities.
Read case study →
Mapping
Water outages
Mapping the end-to-end water outage experience to drive systemic change for Water Corporation.
Read case study →
SERVICE DESIGN · WATER CORPORATION · 2021
Mapping
Water outages
Mapping the end-to-end water outage experience to drive systemic change across a complex, multi-team organisation.
ROLE
Lead Service Designer
DURATION
6 months, 2021
DISCIPLINES
Service design · Research
Facilitation · Capability building
STAKEHOLDERS
60+ across 10 teams
17%
reduction in pipe leaks
and bursts 2020 - 2022
489k
households affected by
outages annually
57k
annual customer contacts
about outages
172+
research insights in a
new centralised database
THE PROBLEM
A system failing in plain sight
Water outages affect about a third of all properties in Western Australia every year. That’s 489,000 households without water for a median of 54 minutes, usually with no warning. For most people this can be frustrating. For a dialysis patient, doctor’s surgery, dentist, farmer, it can have significant safety, health or financial ramifications.
The numbers were only getting worse with the number of outages increasing ~5% each year, driven by ageing infrastructure (old pipes) and upstream process inefficiencies. A combination of organisational silos, clunky internal systems and poor process governance made outage management largely inefficient and near impossible to track - causing financial and reputational costs to Water Corp. Outage resolution times were slower, staff head count per issue was high and customer calls were increasing, with 57,000 outage related customer contacts annually.
I was brought in to map the process end-to-end, understand how outages were actually managed across every team involved, and identify where change would drive real impact - for customers and the business.
25%
of outages were completely missing from the internal management system
85%
of unplanned outages weren't logged until after the water was already off
489k
WA households affected by
outages annually
MY ROLE
I had two key roles to play
Lead the design methodology
I was brought in as an embedded team member to augment the existing design team and lead the design framework for this project. The organisation were able to justify the spend because of the high cost and reputational impact outages were creating. It was a critical problem to solve.
Build the capability and scalable design method
The team were fairly new to human-centred design so I was required to create a scalable design framework they could apply to future projects. The research database, the frameworks, the prioritisation tools were all designed to be reusable once I was gone.
MY APPROACH
Layering the staff experience with the customer journey
The instinct in many CX projects is to go straight to the customer. I made a deliberate call to start by unpacking the staff experience because it was clear, after initial consultation with senior stakeholders, that the real dysfunction was happening behind the scenes.
Over six months I ran 15+ workshops and one-on-ones across 10 different teams. I sat in the Operations Centre and listened to live calls while watching staff work across multiple systems simultaneously. I joined field crew on site. Most of these teams had never been asked about their experience before and were thrilled to talk. The knowledge was all there - it just hadn't been surfaced or connected.
15+ workshops
10 internal teams
656 residential surveys
Experienced outage <6 months
64 non-residential surveys
businesses & key customers
VOC + call listening
social media analysis
Live observation
OC, field crew, reinstatements
172+ research insights
new centralised database
CREATING A RESEARCH DATABASE
I built Water Corp’s first centralised research database (using our best friend, Excel). It was designed to capture and categorise all workshop and research findings in one place. It served as live demonstration of research documentation best-practice and as an aid to improve knowledge sharing between teams. The simple spreadsheet outlived the project and sparked an investment in Dovetail, which the team uses to this day.
THE STAFF EXPERIENCE
Mapping the teams to the process
During this discovery I identified the key teams involved in delivering an outage experience. Across two groups, at least eight distinct roles touched an outage. Each team dealt with different systems, were led by different KPIs, and had varying definitions of success.
Stakeholder map
8 roles across Operations Group and Customer & Community Group - each with different systems, KPIs, and priorities
THE CUSTOMER EXPERIENCE
Mapping the customer impact
Combining insights from customer facing teams, desktop research and two quantitative surveys, we created a simple impact map for our broad customer segments.
Customer type map
7 segments - General residential, Medic Alert, Non-residential, Sensitive, Key Customers, Home businesses, Farms - each with distinct impact profile and current level of support
KEY FINDINGS
What the research revealed
We uncovered several issues that were previously unknown to the business both above and below the line of visibility. It seems technology was the biggest bottle neck for internal teams.
INVISIBLE TO THE ORG
The outage expansion problem nobody knew about
‘Officially’ 2% of outages result in expansions - where a broken valve forces crews to shut off a different valve and affecting significantly more households. The internal estimate is closer to 40%. No team outside field operations were aware of this figure because there's no friction-free way to report a broken valve so the data never made it into the system.
INVISIBLE TO THE ORG
Work arounds for clunky internal systems
Call centre staff use Outlook as a work around to track outages because the dedicated outage management software was far too slow. Outlook allowed them to track calls and jobs in real time, but it meant every job was updated in multiple places, which added time to each job and risks in double-handling and missing an update.
SYSTEMIC FAILURE
Customers were rarely notified about unplanned outages
During a planned outage, customers would receive a letter in their mailbox 48 hours before their water turned off. When 85% of outages are unplanned, and not logged until a few hours before, or sometimes after the water turned off, customers were left without warning. Without this notification, customer impact increases significantly.
HUMAN TENSION
Field crews were set up to fail
"There's water going everywhere and you're trying to get the PDA to load. It takes ages and a minute feels like forever when you're out there."
Before touching a single pipe, a field worker had to call the Operations Centre, provide water on/off ETAs, locate the correct valve on a PDA that took minutes to load, check for nearby sensitive customers, and update the system. All while water floods around them, creating risks to their safety and those around them. Sometimes while being abused and yelled at by residents. The process wasn’t designed for the real circumstances.
SYSTEMIC FAILURE
‘Sensitive’ customer lists 10 years out of date
The organisation talked about "sensitive customers" as a defined group receiving special care. These included dialysis patients, dentists, doctor’s surgery. In reality, the lists were over a decade old, the category didn't formally exist in the customer database, and the level of care depended entirely on which crew showed up. With preserved supply numbers set to grow from ~100 to potentially 3,000 customers, this was urgent.
HUMAN TENSION
Leadership and frontline had never been in the same room
Senior leaders cared about costs and satisfaction scores. Operations Centre staff and field crews cared about immediate safety. Both had rational, well-intentioned priorities - and they had never been brought together to understand how those priorities created friction. The blueprint was the first time both perspectives existed in the same artefact.
THE ARTEFACT
The service blueprint
The blueprint mapped the full outage experience across three phases - unplanned, planned, and after the outage, showing the customer journey running parallel to the actions of every internal team. A ‘line of visibility’ separated what customers could see from what was happening behind the scenes.
The blurry blueprint
(For privacy reasons, I’m not able to share the high-res version)
Storyboard panels
Key moments from the blueprint brought to life through illustrated scenarios, showing the human reality on both sides of the line of visibility.
Storyboard panel 1. Sasha calls Water Corp
Storyboard panel 2. Crew dispatched in rush hour
Storyboard panel 3. Arrive, create outage, locate valves
Storyboard panel 4. Carer and shower scene (sensitive customer)
PRIORITISATION
19 problem statements, one very revealing workshop
After synthesising the research, I wrote 19 problem statements - one for each major pain point. I named them like characters, not jargon: 'The Expanding Expansion Problem.' 'The Outage Surprise.' 'The Slow PDA.' This made them easier to understand for everyone in the room by succinctly capturing the key problem.
I ran a prioritisation workshop with reps from every team. Customer value on one axis, business value on the other, implementation effort as a third lens. The scores were assigned by the SMEs in the room, with the feasibility layer added at the end to uncover true business value.
Opportunity matrix
19 problem statements plotted by business value (x-axis) and customer value (y-axis), scored by SME workshop participants.
Key problem: ‘The Expanding Expansion’
Scored 5/5 on both axes, the only statement to do so.
A problem that had been absent from every report, now sitting at the top of the matrix. Unofficially 40% of all outages impact more households than anticipated I watched senior stakeholders reckon with something they'd had zero visibility of. This was a key moment of the project and helped us reframe our focus for the next phase.
RECOMMENDATIONS
What I recommended and what happened
01
Opt-in outage notifications via SMS and email
QUICK WIN
Move beyond the letterbox slip (which customers rarely noticed) and give people the option to receive alerts via SMS or email, promoted through bills and existing communications. Acknowledge honestly that 85% of outages would still be unplanned, but they would at least be notified the moment the outage entered the system, which could give them the notice they need to prepare.
Outcome
The team launched an opt-in SMS system six months after the project, reducing contact centre load and improving satisfaction scores.
02
Redesign the field crew PDA experience
LONG-TERM
The PDA "water off" trigger was the critical data point for every downstream notification and system update - but it was slow, cumbersome, and used in the most stressful moments of a crew's day. I recommended exploring an audio prompt, a two-person process, or a simpler interface to make the update reliable. Reducing friction here would cascade across data accuracy, customer comms, and the Outlook workaround.
Outcome
The team launched upgraded their PDA’s to access the 4G network meaning it’s now quicker to locate the valve and send updates to internal systems.
03
Invest in proactive asset management and leak detection
LONG-TERM
The volume of unplanned outages was a symptom of ageing infrastructure and poor visibility. I recommended exploring technology that could identify pipe stress before failures - through usage spike monitoring or physical sensing.
Outcome: The Leak Detection Program + 17% reduction in outages
In 2023, Water Corp launched a fibre-optic sensor program to detect leaks before they become bursts. The 17% reduction in pipe failures between 2020 and 2022 reflects the broader shift this project helped initiate.
04
Replace the outage management system - or honour the workaround
LONG-TERM
The Outlook calendar existed because the official systems couldn't keep up. Team leads had already tried and failed to eliminate it. I recommended finding a replacement or supplement that met staff where they were, something fast, reliable and updates in real-time. The root cause of the workaround was legitimate and the organisation needed to work with their staff to co-design a solution fit for their needs.
05
Standardise the sensitive and preserved supply customer process
QUICK WIN
With the preserved supply list about to grow from ~100 to potentially 3,000 customers due to incoming CAPS legislation, inconsistency in vulnerable customer care needed urgent attention. I recommended formally defining "sensitive customer" in the system, establishing clear process ownership, and ensuring the level of care didn't depend on which crew was rostered that night.
REFLECTION
What I learned about working in complex systems
The most important skill gleaned from this project was how to hold complexity without assigning blame. Every workaround I found had a rational reason behind it. The Outlook calendar was genuinely more reliable. Field workers genuinely were safer focusing on the pipe than the PDA. Staff couldn't trust a dashboard that was twenty minutes out of date.
When I presented to senior leadership, I framed the frontline not as the source of the problem, but as evidence of it. These teams were dedicated and resourceful. They'd done what they could with what they had. The onus was on the organisation to build something that worked with its people. Any solution designed without these people just generate a new set of workarounds.
The fibre-optic leak detection program, the SMS notifications, the Dovetail investment, the 17% reduction in pipe failures - they're brilliant outcomes the organisation was finally positioned to pursue, because for the first time, everyone in the room could see what was actually happening.
All projects
Refining My Wellbeing
Designing a product to help students with their mental health.
Read case study →
DesigningResearcher profiles
Helping researchers promote themselves online to increase partnership, global funding and collaboration opportunities.
Read case study →
Mapping
Water outages
Mapping the end-to-end water outage experience to drive systemic change for Water Corporation.
Read case study →
SERVICE DESIGN · WATER CORPORATION · 2021
Mapping
Water outages
Mapping the end-to-end water outage experience to drive systemic change across a complex, multi-team organisation.
ROLE
Lead Service Designer
DURATION
6 months, 2021
DISCIPLINES
Service design · Research
Facilitation · Capability building
STAKEHOLDERS
60+ across 10 teams
489k
households affected by
outages annually
57k
annual customer contacts
about outages
17%
reduction in pipe leaks
and bursts 2020 - 2022
172+
research insights in a
new centralised database
THE PROBLEM
A system failing in plain sight
Water outages affect about a third of all properties in Western Australia every year. That’s 489,000 households without water for a median of 54 minutes, usually with no warning. For most people this can be frustrating. For a dialysis patient, doctor’s surgery, dentist, farmer, it can have significant safety, health or financial ramifications.
The numbers were only getting worse with the number of outages increasing ~5% each year, driven by ageing infrastructure (old pipes) and upstream process inefficiencies. A combination of organisational silos, clunky internal systems and poor process governance made outage management largely inefficient and near impossible to track - causing financial and reputational costs to Water Corp. Outage resolution times were slower, staff head count per issue was high and customer calls were increasing, with 57,000 outage related customer contacts annually.
I was brought in to map the process end-to-end, understand how outages were actually managed across every team involved, and identify where change would drive real impact - for customers and the business.
25%
of outages were completely missing from the internal management system
85%
of unplanned outages weren't logged until after the water was already off
489k
WA households affected by
outages annually
MY ROLE
I had two key roles to play
Lead the design methodology
I was brought in as an embedded team member to augment the existing design team and lead the design framework for this project. The organisation were able to justify the spend because of the high cost and reputational impact outages were creating. It was a critical problem to solve.
Build the capability and scalable design method
The team were fairly new to human-centred design so I was required to create a scalable design framework they could apply to future projects. The research database, the frameworks, the prioritisation tools were all designed to be reusable once I was gone.
MY APPROACH
Layering the staff experience with the customer journey
The instinct in many CX projects is to go straight to the customer. I made a deliberate call to start by unpacking the staff experience because it was clear, after initial consultation with senior stakeholders, that the real dysfunction was happening behind the scenes.
Over six months I ran 15+ workshops and one-on-ones across 10 different teams. I sat in the Operations Centre and listened to live calls while watching staff work across multiple systems simultaneously. I joined field crew on site. Most of these teams had never been asked about their experience before and were thrilled to talk. The knowledge was all there - it just hadn't been surfaced or connected.
15+ workshops
10 internal teams
656 residential surveys
Experienced outage <6 months
64 non-residential surveys
businesses & key customers
VOC + call listening
social media analysis
Live observation
OC, field crew, reinstatements
172+ research insights
new centralised database
CREATING A RESEARCH DATABASE
I built Water Corp’s first centralised research database (using our best friend, Excel). It was designed to capture and categorise all workshop and research findings in one place. It served as live demonstration of research documentation best-practice and as an aid to improve knowledge sharing between teams. The simple spreadsheet outlived the project and sparked an investment in Dovetail, which the team uses to this day.
THE STAFF EXPERIENCE
Mapping the teams to the process
During this discovery I identified the key teams involved in delivering an outage experience. Across two groups, at least eight distinct roles touched an outage. Each team dealt with different systems, were led by different KPIs, and had varying definitions of success.
Stakeholder map
8 roles across Operations Group and Customer & Community Group - each with different systems, KPIs, and priorities
THE CUSTOMER EXPERIENCE
Mapping the customer impact
Combining insights from customer facing teams, desktop research and two quantitative surveys, we created a simple impact map for our broad customer segments.
Customer type map
7 segments - General residential, Medic Alert, Non-residential, Sensitive, Key Customers, Home businesses, Farms - each with distinct impact profile and current level of support
KEY FINDINGS
What the research revealed
We uncovered several issues that were previously unknown to the business both above and below the line of visibility. It seems technology was the biggest bottle neck for internal teams.
INVISIBLE TO THE ORG
The outage expansion problem nobody knew about
‘Officially’ 2% of outages result in expansions - where a broken valve forces crews to shut off a different valve and affecting significantly more households. The internal estimate is closer to 40%. No team outside field operations were aware of this figure because there's no friction-free way to report a broken valve so the data never made it into the system.
INVISIBLE TO THE ORG
Work arounds for clunky internal systems
Call centre staff use Outlook as a work around to track outages because the dedicated outage management software was far too slow. Outlook allowed them to track calls and jobs in real time, but it meant every job was updated in multiple places, which added time to each job and risks in double-handling and missing an update.
SYSTEMIC FAILURE
Customers were rarely notified about unplanned outages
During a planned outage, customers would receive a letter in their mailbox 48 hours before their water turned off. When 85% of outages are unplanned, and not logged until a few hours before, or sometimes after the water turned off, customers were left without warning. Without this notification, customer impact increases significantly.
HUMAN TENSION
Field crews were set up to fail
"There's water going everywhere and you're trying to get the PDA to load. It takes ages and a minute feels like forever when you're out there."
Before touching a single pipe, a field worker had to call the Operations Centre, provide water on/off ETAs, locate the correct valve on a PDA that took minutes to load, check for nearby sensitive customers, and update the system. All while water floods around them, creating risks to their safety and those around them. Sometimes while being abused and yelled at by residents. The process wasn’t designed for the real circumstances.
SYSTEMIC FAILURE
‘Sensitive’ customer lists 10 years out of date
The organisation talked about "sensitive customers" as a defined group receiving special care. These included dialysis patients, dentists, doctor’s surgery. In reality, the lists were over a decade old, the category didn't formally exist in the customer database, and the level of care depended entirely on which crew showed up. With preserved supply numbers set to grow from ~100 to potentially 3,000 customers, this was urgent.
HUMAN TENSION
Leadership and frontline had never been in the same room
Senior leaders cared about costs and satisfaction scores. Operations Centre staff and field crews cared about immediate safety. Both had rational, well-intentioned priorities - and they had never been brought together to understand how those priorities created friction. The blueprint was the first time both perspectives existed in the same artefact.
THE ARTEFACT
The service blueprint
The blueprint mapped the full outage experience across three phases - unplanned, planned, and after the outage, showing the customer journey running parallel to the actions of every internal team. A ‘line of visibility’ separated what customers could see from what was happening behind the scenes.
The blurry blueprint
(For privacy reasons, I’m not able to share the high-res version)
Storyboard panels
Key moments from the blueprint brought to life through illustrated scenarios, showing the human reality on both sides of the line of visibility.
Storyboard panel 1. Sasha calls Water Corp
Storyboard panel 2. Crew dispatched in rush hour
Storyboard panel 3. Arrive, create outage, locate valves
Storyboard panel 4. Carer and shower scene (sensitive customer)
PRIORITISATION
19 problem statements, one very revealing workshop
After synthesising the research, I wrote 19 problem statements - one for each major pain point. I named them like characters: 'The Expanding Expansion Problem.' 'The Outage Surprise.' 'The Slow PDA.' This made them easier to understand for everyone in the room by capturing the key problem.
I ran a prioritisation workshop with reps from every team. Customer value on one axis, business value on the other, implementation effort as a third lens. The scores were assigned by the SMEs in the room, with the feasibility layer added at the end to uncover true business value.
Opportunity matrix
19 problem statements plotted by business value (x-axis) and customer value (y-axis), scored by SME workshop participants.
Key problem: ‘The Expanding Expansion’
Scored 5/5 on both axes, the only statement to do so.
A problem that had been absent from every report, now sitting at the top of the matrix. Unofficially 40% of all outages impact more households than anticipated due to unexpected number of faulty valves on site (senior leadership thought it was only 2%). It scored the highest implementation effort as it requires major asset improvements and significantly more data about true asset health. This was a key moment of the project and helped us reframe our focus for the next phase.
RECOMMENDATIONS
What I recommended and what happened
01
Opt-in outage notifications via SMS and email
QUICK WIN
Move beyond the letterbox slip (which customers rarely noticed) and give people the option to receive alerts via SMS or email, promoted through bills and existing communications. Acknowledge honestly that 85% of outages would still be unplanned, but they would at least be notified the moment the outage entered the system, which could give them the notice they need to prepare.
Outcome
The team launched an opt-in SMS system six months after the project, reducing contact centre load and improving satisfaction scores.
02
Redesign the field crew PDA experience
LONG-TERM
The PDA "water off" trigger was the critical data point for every downstream notification and system update - but it was slow, cumbersome, and used in the most stressful moments of a crew's day. I recommended exploring an audio prompt, a two-person process, or a simpler interface to make the update reliable. Reducing friction here would cascade across data accuracy, customer comms, and the Outlook workaround.
Outcome
The team launched upgraded their PDA’s to access the 4G network meaning it’s now quicker to locate the valve and send updates to internal systems.
03
Invest in proactive asset management and leak detection
LONG-TERM
The volume of unplanned outages was a symptom of ageing infrastructure and poor visibility. I recommended exploring technology that could identify pipe stress before failures - through usage spike monitoring or physical sensing.
Outcome: The Leak Detection Program + 17% reduction in outages
In 2023, Water Corp launched a fibre-optic sensor program to detect leaks before they become bursts. The 17% reduction in pipe failures between 2020 and 2022 reflects the broader shift this project helped initiate.
04
Replace the outage management system - or honour the workaround
LONG-TERM
The Outlook calendar existed because the official systems couldn't keep up. Team leads had already tried and failed to eliminate it. I recommended finding a replacement or supplement that met staff where they were, something fast, reliable and updates in real-time. The root cause of the workaround was legitimate and the organisation needed to work with their staff to co-design a solution fit for their needs.
05
Standardise the sensitive and preserved supply customer process
QUICK WIN
With the preserved supply list about to grow from ~100 to potentially 3,000 customers due to incoming CAPS legislation, inconsistency in vulnerable customer care needed urgent attention. I recommended formally defining "sensitive customer" in the system, establishing clear process ownership, and ensuring the level of care didn't depend on which crew was rostered that night.
REFLECTION
What I learned about working in complex systems
The most important skill gleaned from this project was how to hold complexity without assigning blame. Every workaround I found had a rational reason behind it. The Outlook calendar was genuinely more reliable. Field workers genuinely were safer focusing on the pipe than the PDA. Staff couldn't trust a dashboard that was twenty minutes out of date.
When I presented to senior leadership, I framed the frontline not as the source of the problem, but as evidence of it. These teams were dedicated and resourceful. They'd done what they could with what they had. The onus was on the organisation to build something that worked with its people. Any solution designed without these people just generate a new set of workarounds.
The fibre-optic leak detection program, the SMS notifications, the Dovetail investment, the 17% reduction in pipe failures - they're brilliant outcomes the organisation was finally positioned to pursue, because for the first time, everyone in the room could see what was actually happening.
All projects
Refining My Wellbeing
Designing a product to help students with their mental health.
Read case study →
DesigningResearcher profiles
Helping researchers promote themselves online to increase partnership, global funding and collaboration opportunities.
Read case study →
Mapping
Water outages
Mapping the end-to-end water outage experience to drive systemic change for Water Corporation.
Read case study →